

Question: WITHOUT A PIVOT TABLE. ONLY USING FORMULAS Create a new worksheet called R01_DASHBOARD and create a dashboard based on the SALES table that resembles the
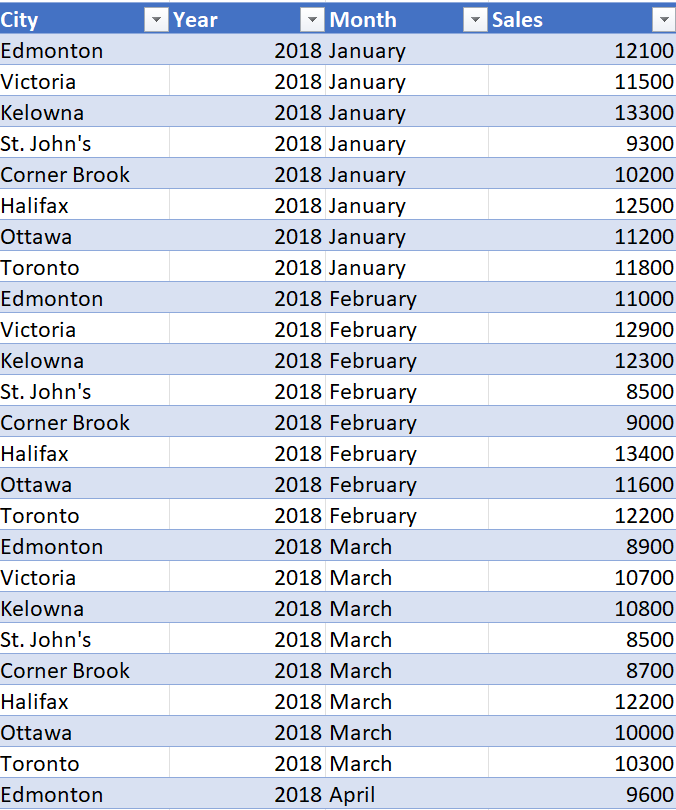
WITHOUT A PIVOT TABLE. ONLY USING FORMULAS Create a new worksheet called R01_DASHBOARD and create a dashboard based on the SALES table that resembles the template shown in Appendix A, with each city in the dataset represented.
The table continues from years 2018 until 2022 showing each cities total sales during what month. How can I include a drop down menu that dynamically updates the data for each year in an appendix a format.
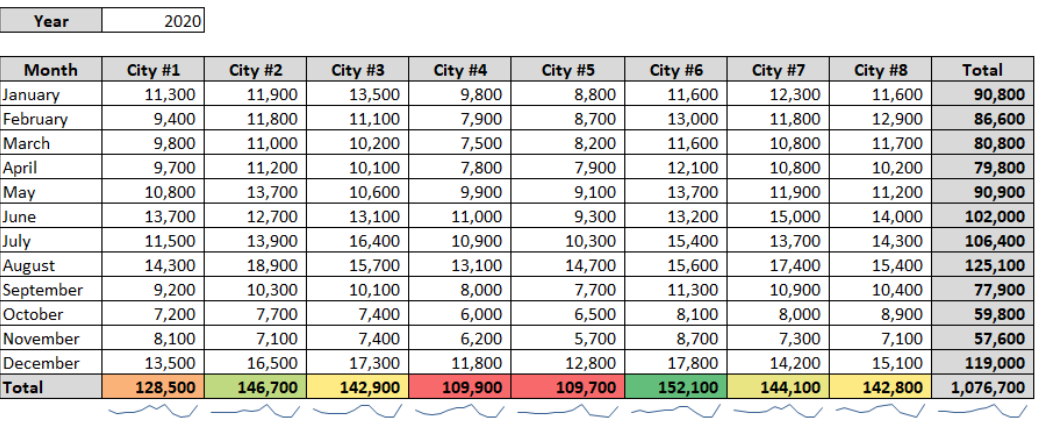
\begin{tabular}{|l|r|} \hline Year & 2020 \\ \hline \end{tabular}
Step by Step Solution
There are 3 Steps involved in it
1 Expert Approved Answer
Step: 1 Unlock

Question Has Been Solved by an Expert!
Get step-by-step solutions from verified subject matter experts
Step: 2 Unlock
Step: 3 Unlock