

Question: Write 3 paragraph describe each chart 80 70 60 50 40 30 20 10 200 150 100 50 0 -50 -100 2021 -9.1 NET INCOME
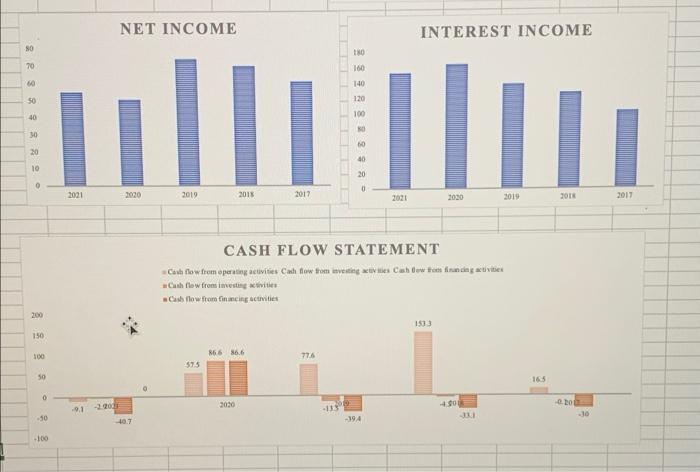
80 70 60 50 40 30 20 10 200 150 100 50 0 -50 -100 2021 -9.1 NET INCOME INTEREST INCOME ill 20 0 2020 2019 2018 2017 2021 2020 2019 2018 CASH FLOW STATEMENT Cash flow from operating activities Cash flow from investing activities Cash Bow from financing activities Cash flow from investing activities Cash flow from financing activities 153.3 86.6 86.6 77.6 57.5 2020 -2.902 40.7 -135 283282222 180 160 140 120 100 -394 4.501 -331 16.5 201 -30 2017
Step by Step Solution
3.37 Rating (150 Votes )
There are 3 Steps involved in it
In first picture there is a bar graph showing Net Income of X company where xaxis is showing year an... View full answer

Get step-by-step solutions from verified subject matter experts