

Refer to Figure 4.16, which shows a randomization distribution for hypotheses H 0 : μ 1 =
Question:
Figure 4.16
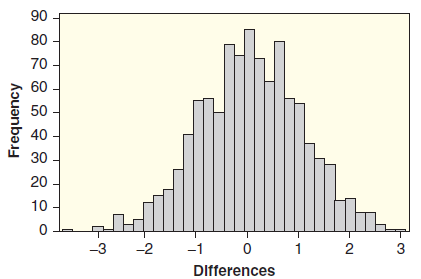
(a) For each D-value, sketch a smooth curve to roughly approximate the distribution in Figure 4.16, mark the D-value on the horizontal axis, and shade in the proportion of area corresponding to the p-value.
(b) Which sample provides the strongest evidence against H0? Why?
D = 0.7 or D = ˆ’1.3
DistributionThe word "distribution" has several meanings in the financial world, most of them pertaining to the payment of assets from a fund, account, or individual security to an investor or beneficiary. Retirement account distributions are among the most...
Fantastic news! We've Found the answer you've been seeking!
Step by Step Answer:
a The figures showing the twotail region beyond ...View the full answer

Answered By
Deborah Joseph
My experience has a tutor has helped me with learning and relearning. You learn everyday actually and there are changes that are made to the curriculum every time so being a tutor has helped in keeping me updated about the present curriculum and all.
I have also been able to help over 100 students achieve better grades particularly in the categories of Math and Biology both in their internal examinations and external examinations.
2+ Reviews
10+ Question Solved
Related Book For 

Statistics, Enhanced Unlocking The Power Of Data
ISBN: 9781119308843
2nd Edition
Authors: Robin H Lock, Patti Frazer Lock, Kari Lock Morgan, Eric F Lock, Dennis F Lock
Question Posted:
