

Question: Consider the gasoline mileage performance data in Table B.3. a. Use the all-possible-regressions approach to find an appropriate regression model. b. Use stepwise regression to
Consider the gasoline mileage performance data in Table B.3.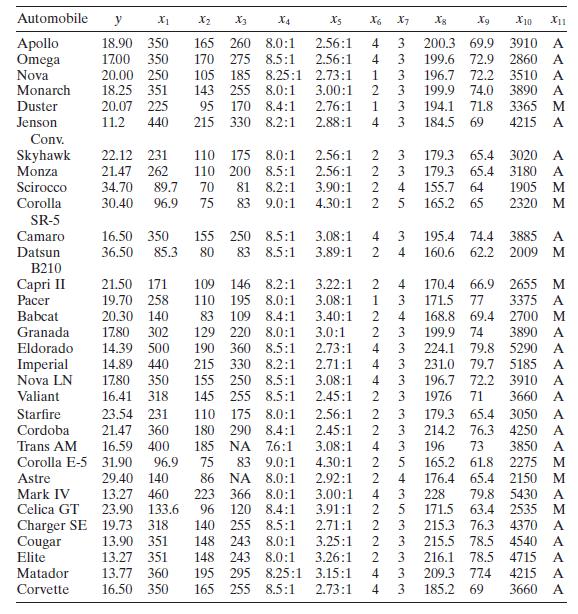
a. Use the all-possible-regressions approach to find an appropriate regression model.
b. Use stepwise regression to specify a subset regression model. Does this lead to the same model found in part a?
Automobile X1 x2 X3 X4 Apollo 18.90 350 165 260 8.0:1 Omega 17.00 350 Nova Monarch Duster Jenson Xs X6 X7 2.56:1 4 170 275 8.5:1 2.56:1 4 20.00 250 105 185 8.25:1 2.73:1 1 18.25 351 143 255 8.0:1 3.00:1 2 199.9 74.0 20.07 225 95 170 8.4:1 2.76:1 1 3 194.1 71.8 11.2 440 215 330 8.2:1 2.88:1 4 3 184.5 69 Xg X9 X10 Xx11 3333mm 200.3 69.9 3910 A 199.6 72.9 2860 A 196.7 72.2 3510 A 3890 A 3365 M 4215 A Conv. Skyhawk 22.12 231 110 175 8.0:1 2.56:1 2 3 179.3 65.4 3020 A Monza 21.47 262 110 200 8.5:1 2.56:1 23 179.3 65.4 3180 A Scirocco 34.70 89.7 70 81 8.2:1 3.90:1 2 4 155.7 64 1905 M Corolla 30.40 96.9 75 83 9.0:1 4.30:1 2 5 165.2 65 2320 M SR-5 Camaro 16.50 350 155 250 8.5:1 3.08:1 4 3 195.4 74.4 3885 A Datsun 36.50 85.3 80 83 8.5:1 3.89:1 24 160.6 62.2 2009 M B210 Capri II 21.50 171 109 146 8.2:1 3.22:1 Pacer 19.70 258 110 195 8.0:1 3.08:1 Babcat 20.30 140 83 109 8.4:1 3.40:1 Granada 17.80 302 129 220 8.0:1 3.0:1 Eldorado 14.39 500 190 360 8.5:1 2.73:1 Imperial 14.89 440 215 330 8.2:1 2.71:1 Nova LN 17.80 350 155 250 8.5:1 3.08:1 Valiant 16.41 318 145 255 8.5:1 2.45:1 Starfire 23.54 231 110 175 8.0:1 2.56:1 Cordoba 21.47 360 Trans AM 16.59 400 180 290 8.4:1 185 NA 76:1 2.45:1 3.08:1 Corolla E-5 31.90 96.9 75 83 9.0:1 4.30:1 Astre 29.40 140 86 NA 8.0:1 2.92:1 Mark IV 13.27 460 223 366 8.0:1 3.00:1 Celica GT 23.90 133.6 96 120 8.4:1 3.91:1 Charger SE 19.73 318 140 255 8.5:1 2.71:1 Cougar 13.90 351 148 243 8.0:1 3.25:1 Elite Matador Corvette 13.27 351 148 243 8.0:1 3.26:1 13.77 360 16.50 350 1555 295 8.25:1 3.15:1 165 255 8.5:1 2.73:1 212242224224222244 2 4 170.4 66.9 2655 M 3 171.5 77 3375 A 2 4 168.8 69.4 2700 M 3 199.9 74 3890 A 3 224.1 79.8 5290 A 4 3 231.0 79.7 5185 A 4 3 196.7 72.2 3910 A 3 1976 71 3660 A 2 3 179.3 65.4 3050 A 2 3 214.2 76.3 4250 A 4 3 196 73 3850 A 25 165.2 61.8 2275 M 2 4 176.4 65.4 2150 M 3 228 79.8 5430 A 5 171.5 63.4 2535 M 2 215.3 76.3 4370 A 2 215.5 78.5 4540 A 3 216.1 78.5 4715 A 3 209.3 77.4 4215 A 185.2 69 3660 A
Step by Step Solution
3.45 Rating (161 Votes )
There are 3 Steps involved in it

Get step-by-step solutions from verified subject matter experts