

Question: Consider the heat treating data in Table B.12. Split the data into prediction and estimation data sets. a. Fit a model to the estimation data
Consider the heat treating data in Table B.12. Split the data into prediction and estimation data sets.
a. Fit a model to the estimation data set using all possible regressions. Select the minimum \(C_{p}\) model.
b. Use the model in part a to predict the responses for each observation in the prediction data set. Calculate \(R^{2}\) for prediction. Comment on model adequacy.
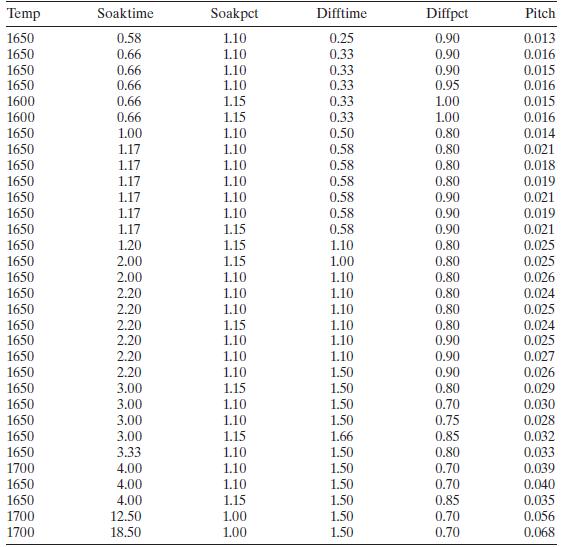
Temp Soaktime Soakpct Difftime Diffpct Pitch 1650 0.58 1.10 0.25 0.90 0.013 1650 0.66 1.10 0.33 0.90 0.016 1650 0.66 1.10 0.33 0.90 0.015 1650 0.66 1.10 0.33 0.95 0.016 1600 0.66 1.15 0.33 1.00 0.015 1600 0.66 1.15 0.33 1.00 0.016 1650 1.00 1.10. 0.50 0.80 0.014 1650 1.17 1.10. 0.58 0.80 0.021 1650 1.17 1.10 0.58 0.80 0.018 1650 1.17 1.10. 0.58 0.80 0.019 1650 1.17 1.10 0.58 0.90 0.021 1650 1.17 1.10. 0.58 0.90 0.019 1650 1.17 1.15 0.58 0.90 0.021 1650 1.20 1.15 1.10 0.80 0.025 1650 2.00 1.15 1.00 0.80 0.025 1650 2.00 1.10 1.10 0.80 0.026 1650 2.20 1.10 1.10 0.80 0.024 1650 2.20 1.10 1.10 0.80 0.025 1650 2.20 1.15 1.10 0.80 0.024 1650 2.20 1.10 1.10 0.90 0.025 1650 2.20 1.10 1.10 0.90 0.027 1650 2.20 1.10 1.50 0.90 0.026 1650 3.00 1.15 1.50 0.80 0.029 1650 3.00 1.10 1.50 0.70 0.030 1650 3.00 1.10 1.50 0.75 0.028 1650 3.00 1.15 1.66 0.85 0.032 1650 3.33 1.10 1.50 0.80 0.033 1700 4.00 1.10 1.50 0.70 0.039 1650 4.00 1.10 1.50 0.70 0.040 1650 4.00 1.15 1.50 0.85 0.035 1700 12.50 1.00 1.50 0.70 0.056 1700 18.50 1.00 1.50 0.70 0.068
Step by Step Solution
3.46 Rating (146 Votes )
There are 3 Steps involved in it

Get step-by-step solutions from verified subject matter experts