

Consider the multiple regression model fit to the National Football League team performance data in Problem 3.1.
Question:
Consider the multiple regression model fit to the National Football League team performance data in Problem 3.1.
Problem 3.1
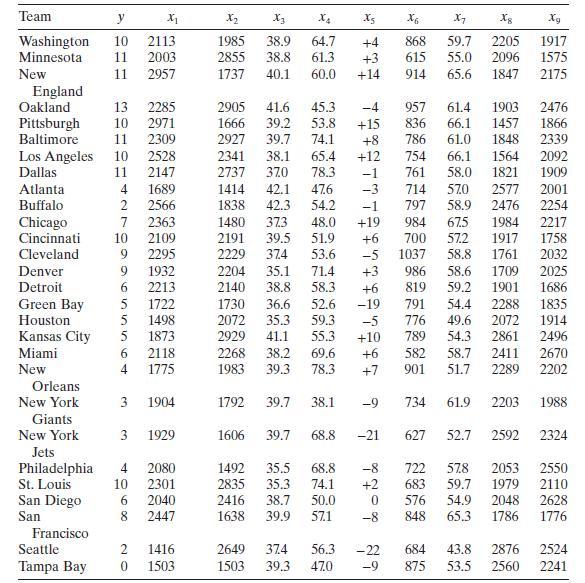
Consider the National Football League data in Table B.1.
a. Construct a normal probability plot of the residuals. Does there seem to be any problem with the normality assumption?
b. Construct and interpret a plot of the residuals versus the predicted response.
c. Construct plots of the residuals versus each of the regressor variables. Do these plots imply that the regressor is correctly specified?
d. Construct the partial regression plots for this model. Compare the plots with the plots of residuals versus regressors from part $\mathrm{c}$ above. Discuss the type of information provided by these plots.
e. Compute the studentized residuals and the $R$-student residuals for this model. What information is conveyed by these scaled residuals?
Step by Step Answer:

This question has not been answered yet.
You can Ask your question!


Introduction To Linear Regression Analysis
ISBN: 9781119578727
6th Edition
Authors: Douglas C. Montgomery, Elizabeth A. Peck, G. Geoffrey Vining
