

Question: Consider the simple linear regression model fit to the ozone data in Problem 2.13. Problem 2.13 Davidson (Update on Ozone Trends in California's South Coast
Consider the simple linear regression model fit to the ozone data in Problem 2.13.
Problem 2.13
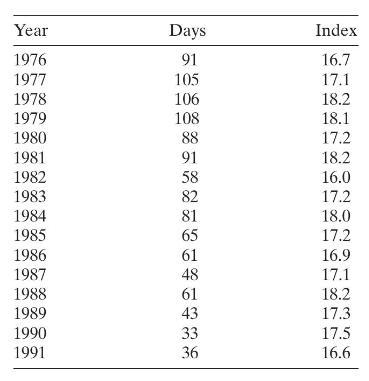
Davidson ("Update on Ozone Trends in California's South Coast Air Basin," Air and Waste, 43, 226, 1993) studied the ozone levels in the South Coast Air Basin of California for the years 1976-1991. He believes that the number of days the ozone levels exceeded $0.20 \mathrm{ppm}$ (the response) depends on the seasonal meteorological index, which is the seasonal average 850-millibar temperature (the regressor). The following table gives the data.
a. Construct a normal probability plot of the residuals. Does there seem to be any problem with the normality assumption?
b. Construct and interpret a plot of the residuals versus the predicted response.
c. Plot the residuals versus time order and comment on the plot.
Year Days Index 1976 91 16.7 1977 105 17.1 1978 106 18.2 1979 108 18.1 1980 88 17.2 1981 91 18.2 1982 58 16.0 1983 82 17.2 1984 81 18.0 1985 65 17.2 1986 61 16.9 1987 48 17.1 1988 61 18.2 1989 43 17.3 1990 33 17.5 1991 36 16.6
Step by Step Solution
3.43 Rating (162 Votes )
There are 3 Steps involved in it

Get step-by-step solutions from verified subject matter experts