

Question: In Problem 3.12, you were asked to fit a model to the clathrate formation data in Table B.8. Problem 3.12 A chemical engineer studied the
In Problem 3.12, you were asked to fit a model to the clathrate formation data in Table B.8.
Problem 3.12
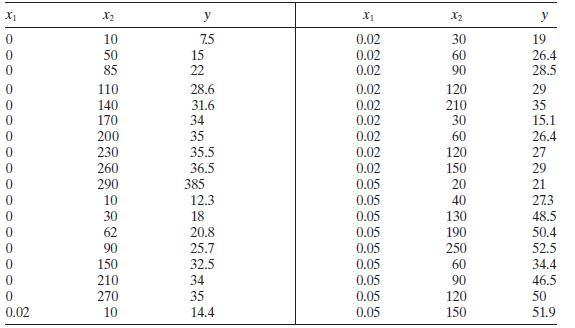
A chemical engineer studied the effect of the amount of surfactant and time on clathrate formation. Clathrates are used as cool storage media. Table B. 8 summarizes the experimental results.
a. Construct a normality plot of the residuals from the full model. Does there seem to be any problem with the normality assumption?
b. Construct and interpret a plot of the residuals versus the predicted response.
c. In Problem 3.12, you were asked to fit a second model. Compute the PRESS statistic for both models. Based on this statistic, which model is most likely to provide better predictions of new data?
x X2 x1 X2 10 7.5 0.02 30 19 50 15 0.02 60 26.4 85 22 0.02 90 28.5 110 28.6 0.02 120 29 140 31.6 0.02 210 35 170 34 0.02 30 15.1 200 35 0.02 60 26.4 230 35.5 0.02 120 260 36.5 0.02 150 290 385 0.05 10 12.3 0.05 30 18 0.05 130 62 20.8 0.05 190 90 25.7 0.05 250 150 32.5 0.05 210 34 0.05 270 35 0.05 120 0.02 10 14.4 0.05 150 88898888888 27 29 20 21 40 27.3 48.5 50.4 52.5 60 34.4 90 46.5 50 51.9
Step by Step Solution
There are 3 Steps involved in it

Get step-by-step solutions from verified subject matter experts