

Question: In Problem 3.9, you were asked to fit a model to the tube-flow reactor data in Table B.6. Data From Problem 3.9 The concentration of
In Problem 3.9, you were asked to fit a model to the tube-flow reactor data in Table B.6.
Data From Problem 3.9
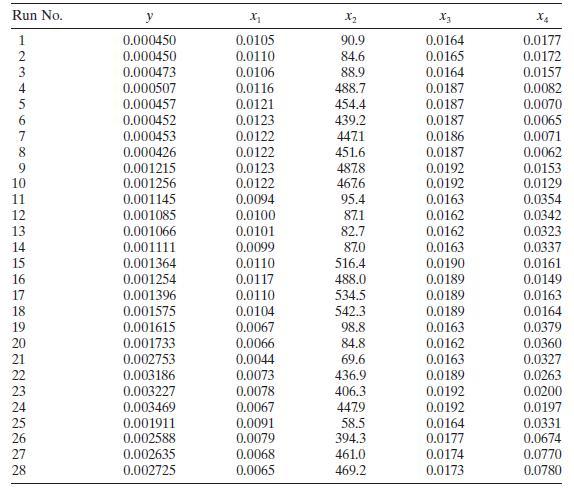
The concentration of $\mathrm{NbOCl}_{3}$ in a tube-flow reactor as a function of several controllable variables is shown in Table B.6.
a. Construct a normal probability plot of the residuals. Does there seem to be any problem with the normality assumption?
b. Construct and interpret a plot of the residuals versus the predicted response.
c. Construct the partial regression plots for this model. Does it seem that some variables currently in the model are not necessary?
Run No. y X2 X4 1234567890123ACKTRA 0.000450 0.0105 90.9 0.0164 0.0177 0.000450 0.0110 84.6 0.0165 0.0172 0.000473 0.0106 88.9 0.0164 0.0157 0.000507 0.0116 488.7 0.0187 0.0082 0.000457 0.0121 454.4 0.0187 0.0070 0.000452 0.0123 439.2 0.0187 0.0065 0.000453 0.0122 447.1 0.0186 0.0071 0.000426 0.0122 451.6 0.0187 0.0062 0.001215 0.0123 487.8 0.0192 0.0153 0.001256 0.0122 467.6 0.0192 0.0129 0.001145 0.0094 95.4 0.0163 0.0354 0.001085 0.0100 87.1 0.0162 0.0342 0.001066 0.0101 82.7 0.0162 0.0323 0.001111 0.0099 87.0 0.0163 0.0337 0.001364 0.0110 516.4 0.0190 0.0161 0.001254 0.0117 488.0 0.0189 0.0149 0.001396 0.0110 534.5 0.0189 0.0163 0.001575 0.0104 542.3 0.0189 0.0164 0.001615 0.0067 98.8 0.0163 0.0379 20 0.001733 0.0066 84.8 0.0162 0.0360 21 0.002753 0.0044 69.6 0.0163 0.0327 22 0.003186 0.0073 436.9 0.0189 0.0263 23 0.003227 0.0078 406.3 0.0192 0.0200 24 0.003469 0.0067 447.9 0.0192 0.0197 25 0.001911 0.0091 58.5 0.0164 0.0331 26 0.002588 0.0079 394.3 0.0177 0.0674 27 0.002635 0.0068 461.0 0.0174 0.0770 28 0.002725 0.0065 469.2 0.0173 0.0780
Step by Step Solution
There are 3 Steps involved in it

Get step-by-step solutions from verified subject matter experts