

Question: 2. How well does the model fit the data? Explain. A Quadratic Model Suppose that you fitted the model E(y) x x 0 1 2
2. How well does the model fit the data? Explain.
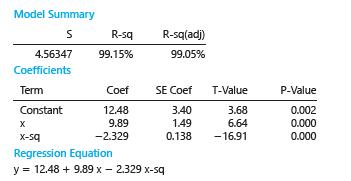
A Quadratic Model Suppose that you fitted the model E(y) x x 0 1 2 2 5b 1b 1b to n520 data points and obtained the following MINITAB printout
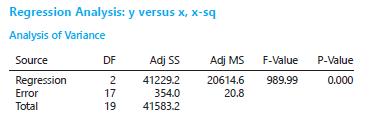
Regression Analysis: y versus x, x-sq Analysis of Variance Source DF Adj SS Adj MS F-Value P-Value Regression 2 41229.2 Error 17 354.0 20614.6 20.8 989.99 0.000 Total 19 41583.2
Step by Step Solution
There are 3 Steps involved in it
1 Expert Approved Answer
Step: 1 Unlock

Question Has Been Solved by an Expert!
Get step-by-step solutions from verified subject matter experts
Step: 2 Unlock
Step: 3 Unlock