

Question: Use the graphical displays to decide whether the data have been selected from a normal population. Explain your answer Percent 13. 99 Normal Probability Plot
Use the graphical displays to decide whether the data have been selected from a normal population. Explain your answer
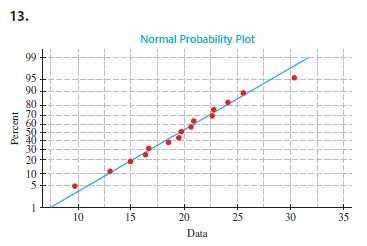
Percent 13. 99 Normal Probability Plot 95 90 80 70 60 40 30 20 10 5 1 10 15 20 25 30 + 35 Data
Step by Step Solution
There are 3 Steps involved in it
1 Expert Approved Answer
Step: 1 Unlock

Question Has Been Solved by an Expert!
Get step-by-step solutions from verified subject matter experts
Step: 2 Unlock
Step: 3 Unlock