

Question: Using the data from Problem 1.1: (a) Which education category has the highest proportion of people in work? What is the proportion? (b) Which category
Using the data from Problem 1.1:
(a) Which education category has the highest proportion of people in work? What is the proportion?
(b) Which category of employment status has the highest proportion of people with a degree? What is the proportion?
Problem 1.1
The following data show the education and employment status of women aged 20–29 (from the 1991 General Household Survey):
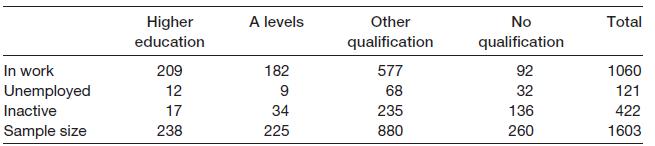
Figure 1.1
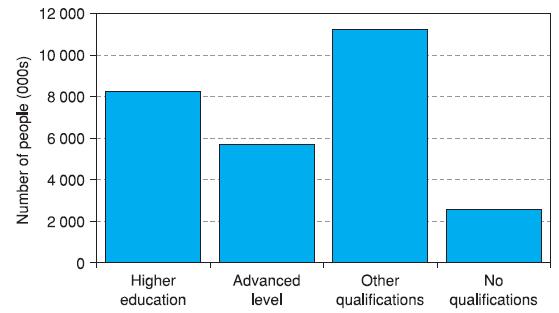
Figure 1.3
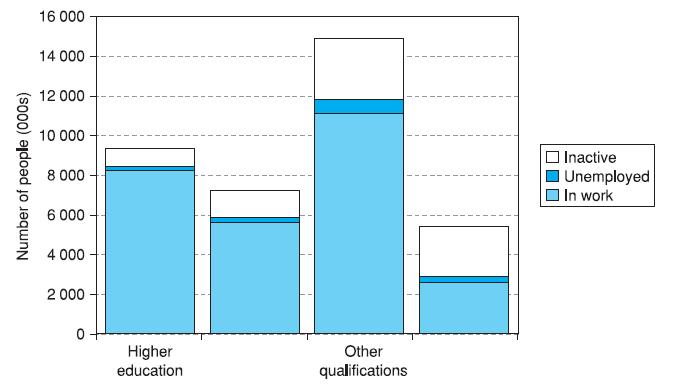
Figure 1.4
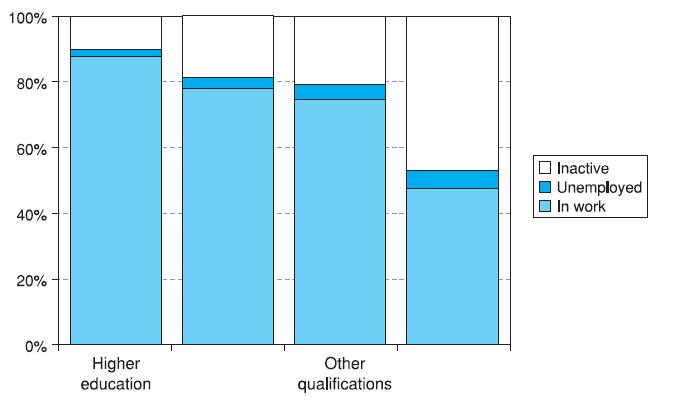
Figure 1.5
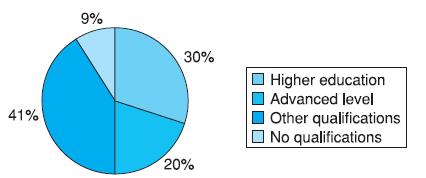
Higher A levels Other No Total education qualification qualification In work 209 182 577 92 1060 Unemployed 12 68 32 121 Inactive 17 34 235 136 422 Sample size 238 225 880 260 1603
Step by Step Solution
3.36 Rating (165 Votes )
There are 3 Steps involved in it
a The education category with the highest proportion of people in work is tho... View full answer

Get step-by-step solutions from verified subject matter experts