

Question: Using the data from Problem 1.2: (a) What is the premium, in terms of median earnings, of a degree over A levels? Does this differ
Using the data from Problem 1.2:
(a) What is the premium, in terms of median earnings, of a degree over A levels? Does this differ between men and women?
(b) Would you expect mean earnings to show a similar picture? What differences, if any, might you expect?
Problem 1.2
The data below show the median weekly earnings (in £s) of those in full time employment in Great Britain in 1992, by category of education.
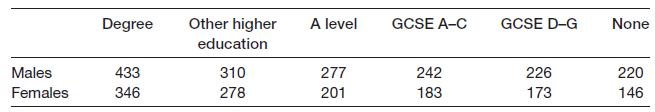
(a) In what fundamental way do the data in this table differ from those in Problem 1.1?
(b) Construct a bar chart showing male and female earnings by education category. What does it show?
(c) Why would it be inappropriate to construct a stacked bar chart of the data? How should one graphically present the combined data for males and females? What extra information is necessary for you to do this?
Problem 1.1
Degree Other higher A level GCSE A-C GCSE D-G None education Males 433 310 277 242 226 220 Females 346 278 201 183 173 146
Step by Step Solution
3.22 Rating (166 Votes )
There are 3 Steps involved in it
Lets address the questions step by step using the data provided in the first table a What is the pre... View full answer

Get step-by-step solutions from verified subject matter experts