

The distribution of marketable wealth in 1979 in the UK is shown in the table below (taken
Question:
The distribution of marketable wealth in 1979 in the UK is shown in the table below (taken from Inland Revenue Statistics 1981, p. 105):
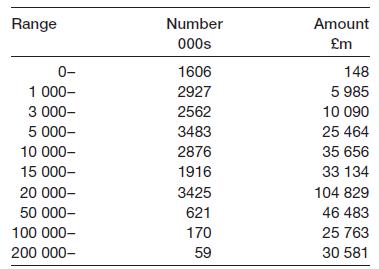
Draw a bar chart and histogram of the data (assume the final class interval has a width of 200 000). Comment on the differences between the two. Comment on any differences between this histogram and the one for 2001 given in the text.
Fantastic news! We've Found the answer you've been seeking!
Step by Step Answer:
To draw a bar chart and histogram of the data we first need to create a frequency tab...View the full answer

Answered By
Rodrigo Louie Rey
I started tutoring in college and have been doing it for about eight years now. I enjoy it because I love to help others learn and expand their understanding of the world. I thoroughly enjoy the "ah-ha" moments that my students have. Interests I enjoy hiking, kayaking, and spending time with my family and friends. Ideal Study Location I prefer to tutor in a quiet place so that my students can focus on what they are learning.
1+ Reviews
10+ Question Solved
Related Book For 
Statistics For Economics Accounting And Business Studies
ISBN: 978027368308
4th Edition
Authors: Michael Barrow
Question Posted:
