

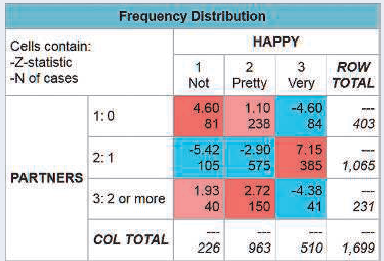
A contingency table from the 2012 GSS relating happiness to number of sex partners in the previous
Question:
Fantastic news! We've Found the answer you've been seeking!
Step by Step Answer:
It seems as though those with no partners or two or mor...View the full answer

Answered By
Pushpinder Singh
Currently, I am PhD scholar with Indian Statistical problem, working in applied statistics and real life data problems. I have done several projects in Statistics especially Time Series data analysis, Regression Techniques.
I am Master in Statistics from Indian Institute of Technology, Kanpur.
I have been teaching students for various University entrance exams and passing grades in Graduation and Post-Graduation.I have expertise in solving problems in Statistics for more than 2 years now.I am a subject expert in Statistics with Assignmentpedia.com.
3+ Reviews
10+ Question Solved
Related Book For 

Statistics The Art And Science Of Learning From Data
ISBN: 9780321997838
4th Edition
Authors: Alan Agresti, Christine A. Franklin, Bernhard Klingenberg
Question Posted:
