

Question: Exercise 9.45 gives output for a regression model to predict number of points for a hockey player based on the number of penalty minutes for
Exercise 9.45 gives output for a regression model to predict number of points for a hockey player based on the number of penalty minutes for the hockey player. Use this output, together with any helpful summary statistics from Table 9.2, to show how to calculate the regression quantities given in parts (a) and (b) below. Verify your results by finding the equivalent results in the output.
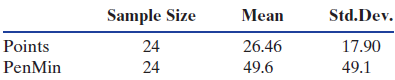
Table 9.2
 (a) The standard deviation of the error term, sÑ”.
(b) The standard error of the slope, SE.
Exercise 9.45
The dataset OttawaSenators contains information on the number of points and the number of penalty minutes for 24 Ottawa Senators NHL hockey players. Computer output is shown for predicting the number of points from the number of penalty minutes:
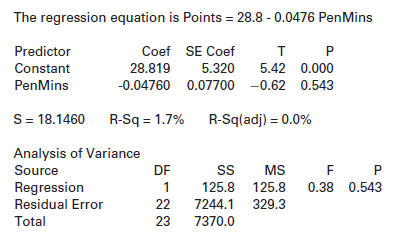
Mean Sample Size Std.Dev. Points PenMin 24 26.46 49.6 17.90 24 49.1 The regression equation is Points = 28.8 - 0.0476 PenMins Predictor Coef SE Coef Constant 28.819 5.320 5.42 0.000 PenMins -0.04760 0.07700 -0.62 0.543 S= 18.1460 R-Sq = 1.7% R-Sq(adj) = 0.0% Analysis of Variance Source DF MS Regression 125.8 125.8 0.38 0.543 Residual Error 22 7244.1 329.3 Total 23 7370.0
Step by Step Solution
3.41 Rating (157 Votes )
There are 3 Steps involved in it
a To find the standard deviation of the error term s we us... View full answer

Get step-by-step solutions from verified subject matter experts