

In Exercise 9.21, we see that the conditions are met for using the pH of a lake
Question:
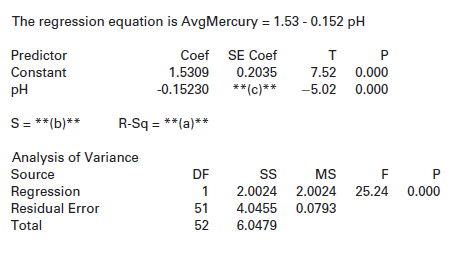
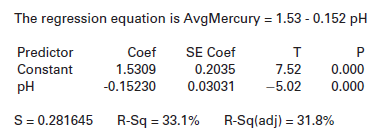
(a) Use the information in the ANOVA table to compute and interpret the value of R2.
(b) Show how to estimate the standard deviation of the error term, sÑ”.
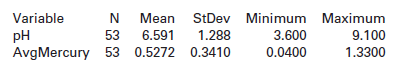
(c) Use the result from part (b) and the summary statistics below to compute the standard error of the slope, SE, for this model:
Exercise 9.21
The FloridaLakes dataset, introduced in Data 2.4, includes data on 53 lakes in Florida. Two of the variables recorded are pH (acidity of the lake water) and AvgMercury (average mercury level for a sample of fish from each lake). We wish to use the pH of the lake water (which is easy to measure) to predict average mercury levels in fish, which is harder to measure. A scatterplot of the data is shown in Figure 2.49(a) on page 106 and we see that the conditions for fitting a linear model are reasonably met. Computer output for the regression analysis is shown below.
Step by Step Answer:
a To calculate R 2 based on the information in the ANOVA table we use We s...View the full answer


Statistics Unlocking The Power Of Data
ISBN: 9780470601877
1st Edition
Authors: Robin H. Lock, Patti Frazer Lock, Kari Lock Morgan, Eric F. Lock, Dennis F. Lock
