

Question: Exercise 9.41 gives output for a regression model to predict calories in a serving of breakfast cereal based on the number of grams of fiber
Table 9.3
 (a) The standard deviation of the error term, sÑ”.
(b) The standard error of the slope, SE.
Exercise 9.41
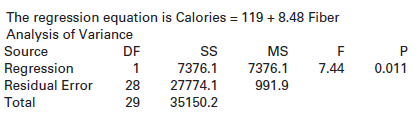
In Data 9.2 on page 540, we introduce the dataset Cereal, which has nutrition information on 30 breakfast cereals. Computer output is shown for a linear model to predict Calories in one cup of cereal based on the number of grams of Fiber. Is the linear model effective at predicting the number of calories in a cup of cereal? Give the F-statistic from the ANOVA table, the p-value, and state the conclusion in context.
In Data 9.2 on page 540
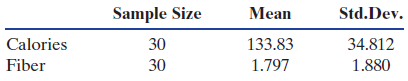
Labels on many food products contain a wealth of nutritional information. The data in Cereal include the number of calories as well as the grams of fat, carbohydrates, fiber, sugars, and protein and milligrams of sodium in each cup of a sample of 30 breakfast cereals from three different manufacturers (General Mills, Kellogg€™s, and Quaker).
Sample Size 30 Mean Std.Dev. Calories Fiber 133.83 34.812 1.880 30 1.797 The regression equation is Calories = 119 + 8.48 Fiber Source Regression Analysis of Variance DF 1 MS 7.44 7376.1 27774.1 35150.2 7376.1 991.9 0.011 Residual Error 28 29 Total
Step by Step Solution
3.46 Rating (162 Votes )
There are 3 Steps involved in it
a To find the standard deviation of the error term s we use the value of SSE from the ANOVA table ... View full answer

Get step-by-step solutions from verified subject matter experts