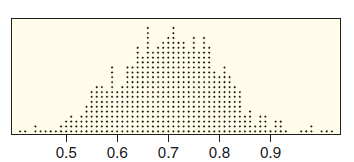
The bootstrap distribution in Figure 3.19(a), generated for a sample proportion. Figure 3.19 a. Use the bootstrap distributions in Figure

Question:

The bootstrap distribution in Figure 3.19(a), generated for a sample proportion.

Figure 3.19 a.

0.7 0.5 0.6 0.8 0.9

Use the bootstrap distributions in Figure 3.19 to estimate the point estimate and standard error, and then use this information to give a 95% confidence interval. In addition, give notation for the parameter being estimated.

Distribution
The word "distribution" has several meanings in the financial world, most of them pertaining to the payment of assets from a fund, account, or individual security to an investor or beneficiary. Retirement account distributions are among the most...

This problem has been solved!


Do you need an answer to a question different from the above? Ask your question!

Step by Step Answer:

Related Book For  answer-question

Statistics Unlocking The Power Of Data

ISBN: 9780470601877

1st Edition

Authors: Robin H. Lock, Patti Frazer Lock, Kari Lock Morgan, Eric F. Lock, Dennis F. Lock

Question Details
Chapter # 3- Confidence Intervals
Section: Exercises
Problem: 67
View Solution
Create a free account to access the answer
Cannot find your solution?
Post a FREE question now and get an answer within minutes. * Average response time.
Question Posted: December 01, 2018 06:32:55