

Question: The bootstrap distribution in Figure 3.19(d), generated for a difference in sample means. Figure 3.19 d. Use the bootstrap distributions in Figure 3.19 to estimate
Figure 3.19 d.
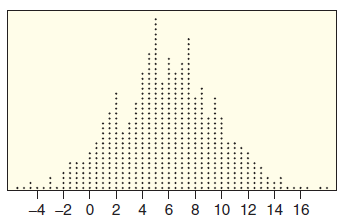
Use the bootstrap distributions in Figure 3.19 to estimate the point estimate and standard error, and then use this information to give a 95% confidence interval. In addition, give notation for the parameter being estimated.
-4 -2 0 2 4 6 8 10 12 14 16
Step by Step Solution
★★★★★
3.40 Rating (159 Votes )
There are 3 Steps involved in it
1 Expert Approved Answer
Step: 1 Unlock

The distribution appears to be centered near 6 so the point estimate is about 6 Using ... View full answer
Question Has Been Solved by an Expert!
Get step-by-step solutions from verified subject matter experts
Step: 2 Unlock
Step: 3 Unlock