

Examine the following figure, which displays hypothetical measurements of a sample of individuals from three groups. a.
Question:
Examine the following figure, which displays hypothetical measurements of a sample of individuals from three groups.
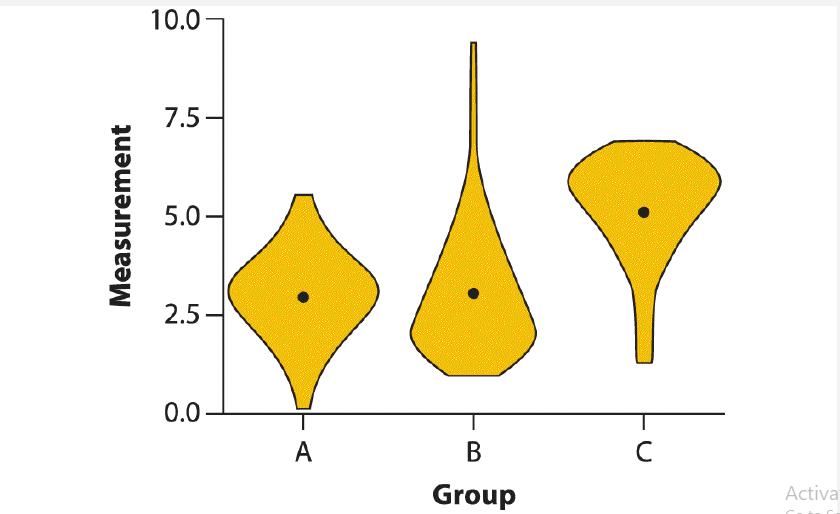
a. What type of graph is this?
b. In which of the groups is the frequency distribution of measurements approximately symmetric?
c. Which of the frequency distributions show negative skew?
d. Which of the frequency distributions show positive skew?
Fantastic news! We've Found the answer you've been seeking!
Step by Step Answer:
The type of graph you sent me is called a box plot It is a statistical tool that g...View the full answer

Answered By
Muhammad Ghyas Asif
It is my obligation to present efficient services to my clients by providing a work of quality, unique, competent and relevant. I hope you have confidence in me and assign me the order and i promise to follow all the instructions and keep time.
109+ Reviews
203+ Question Solved
Related Book For 

The Analysis Of Biological Data
ISBN: 9781319226237
3rd Edition
Authors: Michael C. Whitlock, Dolph Schluter
Question Posted:
