

The slopes of the regression lines on the following graph show that the winning Olympic 100-m sprint
Question:
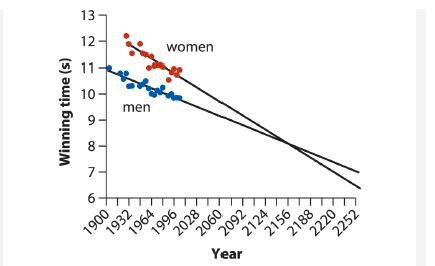
The slopes of the regression lines on the following graph show that the winning Olympic 100-m sprint times for men and women have been getting shorter and shorter over the years, with a steeper trend in women than in men (the graph data is from Tatem et al. 2004). If trends continue, women are predicted to have a shorter winning time than men by the year 2156. What cautions should be applied to this conclusion? Explain.
Fantastic news! We've Found the answer you've been seeking!
Step by Step Answer:
Caution is warranted because the predic...View the full answer

Answered By
Chiranjib Thakur
I have no tutoring experience yet, but I can share my skills and knowledge gained from my education and work experiences. I have been a CPA since 2012 with 6 years of work experience in internal auditing and 4 years of work experience in accounting at the supervisory level.
1+ Reviews
10+ Question Solved
Related Book For 

The Analysis Of Biological Data
ISBN: 9781319226237
3rd Edition
Authors: Michael C. Whitlock, Dolph Schluter
Question Posted:
