

Question: The output below is from a multiple linear regression analysis. The analysis attempts to link a dependent variable y to independent variables x 1 and
The output below is from a multiple linear regression analysis. The analysis attempts to link a dependent variable y to independent variables x1 and x2.
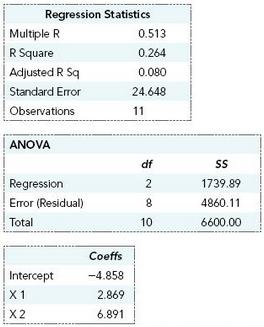
a. Identify and interpret the estimated regression coefficients for x1 and x2.
b. Identify and interpret the standard error of estimate.
c. Identify and interpret the values of r2 and r.
d. Show that r2 is the ratio of explained variation (SSR) to total variation (SST).
Regression Statistics Multiple R R Square Adjusted R Sq Standard Error Observations 0.513 0.264 0.080 24.649 ANOVA df Regression Eor (Residual) Total 173989 4860.11 6600.00 10 Intercept X 1 X2 Coeffs -4.858 2.869 6.891
Step by Step Solution
3.52 Rating (165 Votes )
There are 3 Steps involved in it
a The coefficient for x 1 is 2869 indicating that if x 2 is held constant ... View full answer

Get step-by-step solutions from verified subject matter experts
Document Format (1 attachment)
486-M-S-L-R (3056).docx
120 KBs Word File