New Semester
Started
Get
50% OFF
Study Help!
--h --m --s
Claim Now
Question Answers
Textbooks
Find textbooks, questions and answers
Oops, something went wrong!
Change your search query and then try again
S
Books
FREE
Study Help
Expert Questions
Accounting
General Management
Mathematics
Finance
Organizational Behaviour
Law
Physics
Operating System
Management Leadership
Sociology
Programming
Marketing
Database
Computer Network
Economics
Textbooks Solutions
Accounting
Managerial Accounting
Management Leadership
Cost Accounting
Statistics
Business Law
Corporate Finance
Finance
Economics
Auditing
Tutors
Online Tutors
Find a Tutor
Hire a Tutor
Become a Tutor
AI Tutor
AI Study Planner
NEW
Sell Books
Search
Search
Sign In
Register
study help
mathematics
statistics
Introductory Statistics Exploring The World Through Data 2nd Edition Robert Gould, Colleen Ryan - Solutions
Data are available on the number of calories in 12 ounces of beer for 101 different beers. Make a histogram to show the distribution of the numbers of calories, and describe the distribution. The first few entries are shown in the accompanying table.
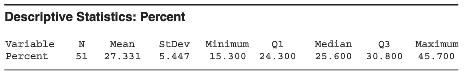
Data are available on the percent alcohol in 101 different beers. Make a histogram of the data, and describe that distribution.
According to the World Health Organization (WHO), there are five leading causes of preventable deaths in the world. They are shown in the graph.a. Estimate how many preventable deaths result from high blood pressure. b. Estimate how many preventable deaths result from tobacco use. c. Does this
Michael Norton (of Harvard) and Dan Ariely (of Duke) did a survey reported in Harvard Magazine (Nov-Dec 2011). They asked respondents to estimate how much of the wealth is held by each quintile (fifth) of the people in the United States. The top quintile is the wealthiest 20% of the people in the
The graph shows the education of residents of Nyeland Acres and Oxnard, both of which are towns in Ventura County in California.a. Which community tends to have more highly educated residents? Explain.b. Which community tends to have the least variation in education?
The 2012 General Social Survey (GSS) asked its respondents to report their political party affiliation. The graphs show the results for 1081 women.a. Which political affiliation has the most women?b. What political affiliation has the second largest number of women? Is this easier to determine with
The bar chart shows the projected percentage of U.S. residents in different age categories by year, according to the 2009 World Almanac and Book of Facts.a. Comment on the predicted changes from 2010 through to 2030. Which age groups are predicted to become larger, which are predicted to become
The table gives information on college majors at Wellesley College, a women's college outside of Boston. Sketch an appropriate graph of the distribution, and comment on its important features. Major Percentage Humanities ........... 30% Social Science ......... 38% Math and Science
The accompanying graph shows the distribution of data on whether houses in a large neighborhood have a garage. (A 1 indicates the house has a garage, and a 0 indicates it does not have a garage.) Is this a bar graph or a histogram? How could the graph be improved?
A student has gathered data on self-perceived body image, where 1 represents "underweight," 2 represents "about right," and 3 represents "overweight." A graph of these data is shown. What type of graph would be a better choice to display these data, and why?
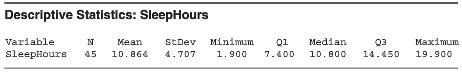
The pie chart reports the number of hours of sleep "last night" for 118 college students. What would be a better type of graph for displaying these data? Explain why this pie chart is hard to interpret.
The histogram shows the distribution of the number of televisions in the homes of 90 community college students.a. According to the histogram, about how many homes do not have a television? b. How many televisions are in the homes that have the most televisions? c. How many homes have three
The graph shows ages of females (labeled 1) and males (labeled 0) who are majoring in psychology in a four year college.a. Is this a histogram or a bar graph? How do you know?b. What type(s) of graph(s) would be more appropriate?
The accompanying graph is a special histogram with additional information; it was made using StatCrunch. People who studied music as children were asked how many hours a day they practiced when they were teenagers, and also whether they still play now that they are adults. To understand the graph,
Refer to the accompanying bar chart, which shows the time spent on a typical day talking on the cell phone for some men and women. Each person was asked to choose the one of four intervals that best fitted the amount of time they spent on the phone (for example, "0 to 4 hours" or "12 or more
The use of the drug Prempro, a combination of two female hormones that many women take after menopause, is called hormone replacement therapy (HRT). In July 2002, a medical article reported the results of a study that was done to determine the effects of Prempro on many diseases. (Source: Women's
A group of students held their breath as long as possible and recorded the times in seconds. The times went from a low of 25 seconds to a high of 90 seconds, as you can see in the stemplot. Suggest improvements to the histogram below generated by Excel, assuming that what is wanted is a histogram
The histograms show the average global temperature per year for two 26-year ranges in degrees Fahrenheit. The range for 1880 to 1905 is on the top, and the range for 1980 to 2005 is on the bottom. Compare the two histograms for the two time periods, and explain what they show. Also estimate the
The histogram shows the distribution of self-reported numbers of hours of exercise per week for 50 community college students. This graph uses a right-hand rule: Someone who exercised for exactly 4 hours would be in the third bin, the bin to the right of 4.a. According to the histogram, there are
Accredited law schools were ranked from 1 for the best (Harvard) down to number 181 by the Internet Legal Research Group (ILRG). When you decide on a law school to attend, one of the things you might be interested in is whether, after graduation, you will be able to get a job for which your law
The graph shows the results of a study done by Guerin et al. (2013) and reported in the New England Journal of Medicine. Patients arriving at emergency rooms who were having trouble breathing were randomly assigned to lie on their backs (supine) or on their stomachs (prone). For each of these
College students Jeannette Mujica, Ricardo Ceja Zarate, and Jessica Cerda conducted a survey in Oxnard, California, of the number of cars going through a yellow light at intersections with and without traffic cameras that are used to automatically fine drivers who run red lights. The cameras were
Thirty-nine students (26 women and 13 men) reported their ideal weight (in most cases, not their current weight). The tables show the data.a. Explain why the distribution of ideal weights is likely to be bimodal if men and women are both included in the sample. b. Make a histogram combining the
The graphs show the distribution of self-reported maximum speed ever driven by men and women college students who drive. Compare shapes, centers, and spreads, and mention any outliers.
The graph shows shoe sizes for men and women. Compare shapes, centers, and spreads, and mention if there are outliers.
The graph is a dotplot of the number of pairs of shoes owned by men and women who took a survey on StatCrunch.a. Shape: What is the shape of each dotplot?b. Center: Is it the males or the females who typically have more pairs of shoes?c. Spread: For which group is the data set more spread out?
One of the authors wanted to determine the effect of changing answers on multiple-choice tests. She had advised her students that if they had changed their minds about a previous answer, they should replace their first choice with their new choice. By looking for erasures on the exam, she was able
The graph shows the rates of visits to the ER for injuries by gender and by age. Note that we are concerned with the rate per 100 people of that age and gender in the population.a. Why does the National Safety Council give us rates instead of numbers of visits?b. For which ages are the males more
At their installations as chief justice of the United States, the first six chief justices were 44, 56, 51, 45, 59, and 56 years old, respectively.a. Find and interpret (report in context) the mean age at installation, rounding to the nearest tenth. The mean age at installation of the six most
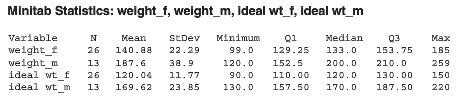
The table shows Minitab descriptive statistics for the weight of some women (weight_f) and men (weight_m), and the self-reported ideal weights for both.a. Subtract the women€™s mean weight from their mean ideal weight to find the mean desired weight change. Did the women (as a group) tend to
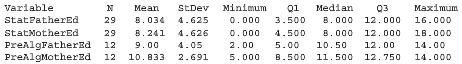
The table shows Minitab descriptive statistics for the years of education for the fathers and mothers of students in one of the author€™s statistics classes and in one of her pre-algebra classes. Twelve years is equivalent to a high school education.a. Are the means higher for those in
College students and surfers Rex Robinson and Sandy Hudson collected data on the self-reported numbers of days surfed in a month for 30 longboard surfers and 30 shortboard surfers.Longboard: 4, 9, 8, 4, 8, 8, 7, 9, 6, 7, 10, 12, 12, 10, 14, 12, 15, 13, 10, 11, 19, 19, 14, 11, 16, 19, 20, 22, 20,
College student Jacqueline Loya asked a group of 50 employed students how many times they went out to eat in the last week. Half of the students had full-time jobs, and half had part-time jobs.Full@time jobs: 5, 3, 4, 4, 4, 2, 1, 5, 6, 5, 6, 3, 3, 2, 4, 5, 2, 3, 7, 5, 5,1, 4, 6, 7Part@time jobs: 1,
Look at the two histograms, created from 2009 real estate data taken from the Ventura County Star, and decide whether you think the standard deviation of home prices in Agoura, California (A), was larger or smaller than the standard deviation of home prices in Westlake, California (B). Explain.
The histograms contain data with a range of 1 to 6. Which group would have the larger standard deviation, group A or group B? Why?
Mrs. Johnson’s children are 2, 2, 3, and 5 years of age.a. Calculate the standard deviation of their current ages.b. Without doing any calculation, indicate whether the standard deviation of the ages in 20 years will be larger, smaller, or the same as the standard deviation of their current ages.
The pay rates for 3 people were the following numbers of dollars per hour: 8, 10.5, and 7. In Mexican pesos (if the exchange rate is 10 pesos per dollar), these pay rates are 80, 105, and 70 pesos per hour.a. Compare the mean in dollars with the mean in pesos; don’t forget the units. Explain what
In the most recent summer Olympics, do you think the standard deviation of the running times for all men who ran the 100-meter race would be larger or smaller than the standard deviation of the running times for the men’s marathon? Explain.
The brain size (in hundreds of thousands of pixels) is reported for some men and women in the table. €œIn Vivo Brain Size and Intelligence,€ Intelligence, 15, 223€“228.)a. Make two separate stemplots (or dotplots or histograms). Does either data set show strong skew? If so, is the
A survey on StatCrunch asked people to report their level of happiness from 1 (least happy) to 100 (most happy). The table shows a sample of 20 female and 20 male responses.a. Make two separate stemplots (or dotplots or histograms). (Don€™t forget to show empty stems if you are making a
The number of alcoholic drinks per week is given for adult men and women who drink. The data are at this text’s website.a. Compare the mean number of drinks for men and women.b. Compare the standard deviation of the number of drinks of men and of women.c. Remove the outliers of 70 and 48 drinks
The birth weights (in grams) are given for babies born to 22 mothers who smoked during their pregnancy and to 35 mothers who did not smoke. Seven pounds is about 3200 grams. (Source: Smoking Mothers, Holcomb 2006, accessed via StatCrunch. Owner: kupresanin99)a. Compare the means and standard
In 2011, the mean rate of violent crime (per 100,000 people) for the 24 states west of the Mississippi River was 406. The standard deviation was 177. Assume that the distribution of violent crime rates is approximately unimodal and symmetric. See page 134 for guidance.a. Between what two values
In 2011, the mean rate of violent crime (per 100,000 people) for the 10 northeastern states was 314, and the standard deviation was 118. Assume the distribution of violent crime rates is approximately unimodal and symmetric. a. Between what two values would you expect to find about 95% of the
In 2011, the mean property crime rate (per 100,000 people) for the 11 western states was about 3331; the standard deviation was 729. Assume the distribution of crime rates is unimodal and symmetric.a. What percentage of western states would you expect to have property crime rates between 2602 and
In 2011, the mean property crime rate (per 100,000 people) for the 10 states in the Northeast was 2400; the standard deviation was 400. Assume the distribution of property crime rates is approximately unimodal and symmetric.a. Approximately what percentage of northeastern states would you expect to
The dotplot shows heights of college women; the mean is 64 inches (5 feet 4 inches), and the standard deviation is 3 inches.a. What is the z-score for a height of 58 inches (4 feet 10 inches)? b. What is the height of a woman with a z-score of 1?
Refer to the dotplot in the previous question.The dotplot shows heights of college women; the mean is 64 inches (5 feet 4 inches), and the standard deviation is 3 inches.a. What is the height of a woman with a z-score of -1?b. What is the z-score for a woman who is 70 inches tall (5 feet 10 inches)?
Wechsler IQ tests have a mean of 100 and a standard deviation of 15. Which is more unusual, an IQ of 115 or an IQ of 80?
Distributions of gestation periods (lengths of pregnancy) for humans are roughly bell-shaped. The mean gestation period for humans is 272 days, and the standard deviation is 9 days for women who go into spontaneous labor. Which is more unusual, a baby being born 9 days early or a baby being born 9
Babies born weighing 2500 grams (about 5.5 pounds) or less are called low-birth-weight babies, and this condition sometimes indicates health problems for the infant. The mean birth weight for U.S.-born children is about 3462 grams (about 7.6 pounds). The mean birth weight for babies born one month
Babies born after 40 weeks gestation have a mean length of 52.2 centimeters (about 20.6 inches). Babies born one month early have a mean length of 47.4 cm. Assume both standard deviations are 2.5 cm and the distributions are unimodal and symmetric. (Source: www.babycenter.com) a. Find the
Assume that women’s heights have a mean of 64 inches (5 feet 4 inches) and a standard deviation of 2.5 inches.a. What women’s height corresponds to a z-score of 1.00?b. What women’s height corresponds to a z-score of – 1.20?
The quantitative portion of the SAT exam has a mean of 500 and a standard deviation of 100.a. What SAT score corresponds to a z-score of – 1.50?b. What SAT score corresponds to a z-score of 1.8?
Name two measures of the center of a distribution, and state the conditions under which each is preferred for describing the typical value of a single data set.
The ten top-grossing Pixar animated movies for the U.S. box office up to June 2013 are shown in the table on the next page, in millions of dollars. a. Sort the gross income from smallest (on the left) to largest, and write down the sorted list. Find the median by averaging the two middle numbers.
The ten top-grossing DreamWorks animated movies for the U.S. box office up to July 2013 are shown in the table, in millions of dollars. Movie $MillionsShrek 2 ............441Shrek the Third ..........323Shrek ..............268Shrek Forever After ........268How to Train Your Dragon
Find the median and interquartile range of the top seven Pixar animated movies; refer to Exercise 3.41 for the data. In exercise Movie $Millions Toy Story 3 ......... 415 Finding Nemo ........ 340 Up .............. 293 Incredible ........... 261 Monsters, Inc. ........ 256 Monsters
Find the median and interquartile range of the top seven Dreamworks animated movies; refer to Exercise 3.42 for the data. In exercise, the ten top-grossing DreamWorks animated movies for the U.S. box office up to July 2013 are shown in the table, in millions of dollars. Movie
Use the data in Exercise 3.24 on the happiness of men and women.a. Compare the median happiness level for the men to that for the women by copying the sentence below and filling in the blanks.The median for the men was _________ and the median for the women was _________, showing that the typical
The number of alcoholic drinks per week is given for 45 adult men and 36 women who drink. The data are at this text€™s website.a. Compare the median numbers of drinks for men and women.b. Compare the interquartile ranges of the numbers of drinks for men and women.c. Remove the outliers of 70
According to Forbes.com, the numbers of billionaires in the five states in the Midwest with the most billionaires are given in the table.Illinois ........20Wisconsin ........10Michigan .......10Minnesota ........ 6Ohio .......... 5a. Find and report the mean number of billionaires per state in
In 1994, major league baseball players went on strike. At the time, the average salary was $1,049,589, and the median salary was $337,500. If you were representing the owners, which summary would you use to convince the public that a strike was not needed? If you were a player, which would you use?
The graphs show the circumferences of heads for a group of men and a group of women.a. If you were describing the men's heads in terms of shape, center, and spread, without comparing them to the women's heads, would you use the mean and standard deviation or the median and interquartile range?
The graphs show the house prices (in hundreds of thousands of dollars) in two fictitious towns.a. If you were describing the prices in Town A in terms of shape, center, and spread, without comparing them to the prices in Town B, would you use the mean and standard deviation or the median and
The histograms show the number of pairs of shoes reported for 300 males and for 300 females. Descriptive statistics are also shown.a. Describe the shape of each histogram.b. Because of the shapes, what measures of the center should be compared, the means or the medians?c. Because of the shapes,
A StatCrunch survey asked people what maximum income tax rate (as a percentage of income) should be allowed and whether they were Republican or Democrat. Compare the two political parties. Compare shapes and appropriate measures of the center and spread.
The figure shows the population density (people per square mile) for the 50 states in the United States, based on an estimate from the U.S. Census Bureau. The regions are the Midwest (MW), Northeast (NE), South (S), and West (W). In the West, the potential outlier is California, and in the South,
The boxplot shows the property crime rate per 100,000 residents in the 50 states. The outlier is Delaware. The regions are the Midwest (MW), Northeast (NE), South (S), and West (W).a. List the approximate median crime rates per 100,000 residents for the four regions; for example, the median for the
The boxplot shows temperatures for six cities. Each city€™s boxplot was made from 12 temperatures: the average monthly temperature over a period of years. Which city tends to be warmest? Which city has the most variation in temperatures? Compare the temperatures of the cities by
The boxplots show the brain size (in hundreds of thousands of pixels) for 20 men and 20 women. Estimate the numerical values of the medians by using the boxplots. Do these men, or do these women, have greater variation in brain size? Why?
a. Report the shape of each histogram.b. Match each histogram with the corresponding boxplot (A, B, or C).
According to Forbes.com, the numbers of billionaires in the five states in the Northeast with the most billionaires are given in the table.New York .........67Connecticut .........11Pennsylvania ........ 7Massachusetts ........ 7New Jersey ......... 5a. Find and report the mean number of
Match each of the histograms (X, Y, and Z) with the corresponding boxplot (C, M, or P). Explain your reasoning.
Data at this text€™s website show the average amount of time animals sleep per day (in hours). The number listed for humans is 8 hours. You may either make a boxplot with technology using the data at this text€™s website or make a sketch of the boxplot from the descriptive statistics below.
The data show the percentage of residents with bachelor€™s degrees in the 50 states and Washington, DC. Make a boxplot of the data. You may either make a boxplot with technology using the data at this text€™s website or sketch the boxplot using the descriptive statistics below. Washington,
The dotplot shows the distribution of the world€™s tallest buildings with respect to their height, in feet. The five-number summary is745 ft, 810 ft, 883 ft, 1093 ft, 2717 ftDraw a boxplot. Describe the shape of the distribution.
The dotplot shows the distribution of passing rates for the bar exam at 185 law schools in the United States in 2009.The five number summary is26, 80, 86, 90, 100Draw the boxplot and explain how you determined where the whiskers go.
The five-number summary for a distribution of final exam scores is 40, 78, 80, 90, 100 Explain why it is not possible to draw a boxplot based on this information.
The five-number summary for a distribution of final exam scores is 60, 78, 80, 90, 100 Is it possible to draw a boxplot based on this information? Why or why not?
The table shows the numbers of capital prisoners (prisoners on death row) in 2013 in the southern U.S. states.a. Find the median number of prisoners and interpret (using a sentence in context).b. Find the interquartile range (showing Q3 and Q1 in the process) to measure the variability in the
The table shows the numbers of capital prisoners (prisoners on death row) in 2013 in the western U.S. states.a. Find the median.b. Find the interquartile range (showing Q3 and Q1 in the process).c. Find the mean number of capital prisoners.d. Why is the mean so much larger than the median?
Following are head circumferences, in centimeters, for some men and women in a statistics class.Men: 58, 60, 62.5, 63, 59.5, 59, 60, 57, 55Women: 63, 55, 54.5, 53.5, 53, 58.5, 56, 54.5, 55, 56, 56, 54, 56, 53, 51Compare the circumferences of the men’s and the women’s heads. Start with
This list represents the numbers of paid vacation days required by law for different countries.United States ......... 0Australia ..........20Italy ...........20France ..........30Germany .........24Canada ...........10a. Find the mean, rounding to the nearest tenth of a day. Interpret the mean in
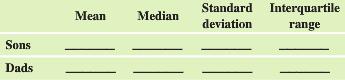
The data at this text's website give the heights of 18 male college students and their fathers, in inches.a. Make histograms and describe the shapes of the two data sets from the histograms.b. Fill in the following table to compare descriptive statistics.c. Compare the heights of the sons and their
The data that follow are final exam grades for two sections of statistics students at a community college. One class met twice a week relatively late in the day; the other class met four times a week at 11 a.m. Both classes had the same instructor and covered the same content. Is there evidence
College students Diane Glover and Esmeralda Olguin asked 25 men and 25 women how many speeding tickets they had received in the last three years.Men: 14 men said they had 0 tickets, 9 said they had 1 ticket, 1 had 2 tickets, and 1 had 5 tickets.Women: 18 said they had 0 tickets, 6 said they had 1
The histogram of marathon times includes data for men and women and also for both an Olympic marathon and an amateur marathon. Greater values indicate slower runners.a. Describe the shape of the distribution. b. What are two different possible reasons for the two modes? c. Knowing that there are
A StatCrunch survey asked people about their consumption of soda as a percentage of liquid intake. The data for 130 males and 130 females can be found at this text’s website. Compare the two groups with histograms and appropriate measures of center and spread.
A StatCrunch survey asked people how much money they spent for gifts during the holidays. Compare the males and females, using both graphical and numerical summaries. Calculate the numbers from the data at this text’s website.
a. State an approximate value for the mean height by looking at the graph.b. Here is a proposed method for finding an approximation for the standard deviation based on the histogram: Find the approximate range and divide by 6. This method comes from the idea that nearly all the data should be
In 2012, the General Social Survey asked respondents how many children they felt would be in an €œideal€ family. The histogram contains the data from 1730 people who responded to the survey.a. Approximately what is the mean ideal number of children? Explain how you chose this
The means are the same, but the standard deviation of one of the sets is larger than that of the other. Report the mean and both standard deviations.
This list represents the number of children for the first six “first ladies” of the United States.Martha Washington .........0Abigail Adams ..........5Martha Jefferson .........6Dolley Madison............0Elizabeth Monroe .........2Louisa Adams...........4a. Find the mean number of children,
The means are different, but the standard deviations are the same. Report both means and the standard deviation.
The mean of set A is larger than that of set B, but the median of set B is larger than the median of set A. Label each dotplot with its mean and median in the correct place.
The standard deviation of set A is larger, but the interquartile range of set B is larger. Report both standard deviations and inter-quartile ranges.
College students and surfers Rex Robinson and Sandy Hudson collected data on the self-reported numbers of days surfed in a month for 30 longboard surfers and 30 shortboard surfers.Longboard: 4, 9, 8, 4, 8, 8, 7, 9, 6, 7, 10, 12, 12, 10, 14, 12, 15, 13, 10, 11, 19, 19, 14, 11, 16, 19, 20, 22, 20,
College student Jacqueline Loya asked 50 employed students how many times they went out to eat last week. Half of the students had full-time jobs and half had part-time jobs.Full-time: 5, 3, 4, 4, 4, 2, 1, 5, 6, 5, 6, 3, 3, 2, 4, 5, 2, 3, 7, 5, 5, 1, 4, 6, 7Part-time: 1, 1, 5, 1, 4, 2, 2, 3, 3, 2,
A group of 50 statistics students, 25 men and 25 women, reported the number of hours per week spent studying statistics.a. Refer to the histograms. Which measure of the center should be compared: the means or the medians? Why?b. Compare the distributions in context using appropriate measures.
Showing 20200 - 20300
of 88243
First
196
197
198
199
200
201
202
203
204
205
206
207
208
209
210
Last
Step by Step Answers
.png)
.png)
.png)
.png)
.png)
.png)
.png)
.png)
.png)
.png)
.png)
.png)
.png)
.png)
.png)
.png)
.png)
.png)
.png)
.png)
.png)
.png)
.png)
.png)
.png)
.png)
.png)
.png)
.png)
.png)
.png)
.png)
.png)
.png)
.png)
.png)
.png)
.png)
.png)
.png)
.png)
.png)
.png)
.png)
.png)
.png)
.png)
.png)
.png)
-1.png)
.png)

