New Semester
Started
Get
50% OFF
Study Help!
--h --m --s
Claim Now
Question Answers
Textbooks
Find textbooks, questions and answers
Oops, something went wrong!
Change your search query and then try again
S
Books
FREE
Study Help
Expert Questions
Accounting
General Management
Mathematics
Finance
Organizational Behaviour
Law
Physics
Operating System
Management Leadership
Sociology
Programming
Marketing
Database
Computer Network
Economics
Textbooks Solutions
Accounting
Managerial Accounting
Management Leadership
Cost Accounting
Statistics
Business Law
Corporate Finance
Finance
Economics
Auditing
Tutors
Online Tutors
Find a Tutor
Hire a Tutor
Become a Tutor
AI Tutor
AI Study Planner
NEW
Sell Books
Search
Search
Sign In
Register
study help
mathematics
statistics
Introductory Statistics Exploring The World Through Data 2nd Edition Robert Gould, Colleen Ryan - Solutions
College student Sandy Hudson asked a group of college students the total number of traffic accidents they had been in as drivers. The histograms are shown, and the table displays some descriptive statistics.Women€™s Driving Accidents a. Refer to the histograms. If we wish to compare the
At their inauguration, the ages of the first six presidents of the United States were 57, 61, 57, 57, 58, and 57.a. Find the mean age at inauguration, rounding to the nearest tenth. The mean of the most recent six presidents (Carter to Obama) was 55.3. Did the first six presidents tend to be a bit
Quantitative SAT scores have a mean of 500 and a standard deviation of 100, while ACT scores have a mean of 21 and a standard deviation of 5. Assuming both types of scores have distributions that are unimodal and symmetric, which is more unusual: a quantitative SAT score of 750 or an ACT score of
Mrs. Diaz has two children: a three-year-old boy 43 inches tall and a ten-year-old girl 57 inches tall. Three-year-old boys have a mean height of 38 inches and a standard deviation of 2 inches, and ten-year-old girls have a mean height of 54.5 inches and a standard deviation of 2.5 inches. Assume
Here are the ages of some students in a statistics class: 17, 19, 35, 18, 18, 20, 27, 25, 41, 21, 19, 19, 45, and 19. The teacher€™s age is 66 and should be included as one of the ages when you do the calculations below. The figure shows a histogram of the data.a. Describe the distribution of
Both scatterplots concern the assessed value of land (with homes on the land), and both depict the same observations.a. Which do you think has a stronger relationship with value of the land€”the number of acres of land or the number of rooms in the homes? Why?b. If you were trying to predict
Both scatterplots concern the total assessed value of properties that include homes, and both depict the same observations.a. Which do you think has a stronger relationship with value of the property€”the number of square feet in the home (shown in part B of the figure) or the number of
The table shows the number of people living in a house and the weight of trash (in pounds) at the curb just before trash pickup.People Trash (pounds)2 ...........183 ...........336 ...........931 ...........237 ...........83a. Find the correlation between these numbers by using a computer or a
The table for part a shows approximate distances between selected cities and the approximate cost of flights between those cities in November 2009.a. Calculate the correlation of the numbers shown in the part a table by using a computer or statistical calculator.Cost Miles180 ....... 960400
The correlation between house price (in dollars) and area of the house (in square feet) for some houses is 0.91. If you found the correlation between house price in thousands of dollars and area in square feet for the same houses, what would the correlation be?
Seth Wagerman, a professor at California Lutheran University, went to the website RateMyProfessors.com and looked up the quality rating and also the “easiness” of the six full-time professors in one department. The ratings are 1 (lowest quality) to 5 (highest quality) and 1 (hardest) to 5
Five people were asked how many female first cousins they had and how many male first cousins. The data are shown in the table. Assume the trend is linear, find the correlation, and comment on what it means.Female Male2 ............41 ............03 ............25 ............82 ............2
The table gives some hypothetical data for number of hours of video games played in a day and BMI (body mass index) for some young teenagers. Assume that the trend is linear, calculate the correlation, and explain what the sign shows. (Although these are hypothetical data, there have been studies
The table gives data on the heights (above ground) of the left and right seats of a see-saw (in feet). Assume the trend is linear, calculate the correlation, and explain what it shows.Left Right4 ..........03 ..........12 ..........21 ..........30 ..........4
The scatterplot shows the median starting salaries and the median mid-career salaries for graduates at a selection of colleges.a. As the data are graphed, which is the independent and which the dependent variable? b. Why do you suppose median salary at a school is used instead of the mean? c. Using
The graph shows the heights of mothers and daughters.a. As the data are graphed, which is the independent variable and which the dependent variable? b. From the graph, approximate the predicted height of the daughter of a mother who is 60 inches (5 feet) tall. c. From the equation, determine the
The scatterplot shows the median annual pay for college-educated men and women in the 50 states in 2005, according to the U.S. Census Bureau. The correlation is 0.834. The regression equation is above the graph.a. Find a rough estimate (by using the scatterplot) of median pay for women in a state
a. Using the graph, estimate the predicted price for a home with 3000 square feet.b. Use the equation to predict the price for a home with 3000 square feet.
TI-84 output from a linear model for predicting armspan (in centimeters) from height (in inches) is given in the figure. Summary statistics are also provided.To do parts a€“c, assume that the association between armspan and height is linear.a. Report the regression equation, using the words
The computer output shown below is for predicting foot length from hand length (in cm) for a group of women. Assume the trend is linear. Summary statistics for the data are shown in the table below.The regression equation is y = 5.67 + 0.998 x Pearson correlation of HandL and FootL = 0.948 a.
Measurements were made for a sample of adult men. A regression line was fit to predict the men€™s armspan from their height. The output from several different statistical technologies is provided. The scatterplot confirms that the association between armspan and height is linear.a. Report
Measurements were made for a sample of adult men. Assume that the association between their hand length and foot length is linear. Output for predicting foot length from hand length is provided from several different statistical technologies.a. Report the equation for predicting foot length from
The scatterplot shows a solid blue line for predicting weight from age of men; the dotted red line is for predicting weight from age of women. The data were collected from a large statistics class.a. Which line is higher and what does that mean?b. Which line has a steeper slope and what does that
The figure shows a scatterplot of the last two digits of some students€™ Social Security numbers and their ages.a. If a regression line were drawn on this graph, would it have a positive slope, a negative slope, or a slope near 0?b. Give an estimate of the numerical value of the
The figure shows a scatterplot of the height of the left seat of a seesaw and the height of the right seat of the same seesaw. Estimate the numerical value of the correlation, and explain the reason for your estimate.
Indicate which variable you think should be the predictor (x) and which variable should be the response (y). Explain your choices.a. You collect data on the number of gallons of gas it takes to fill up the tank after driving a certain number of miles. You wish to know how many miles you’ve driven
Indicate which variable you think should be the predictor (x) and which variable should be the response (y). Explain your choices.a. Weights of nuggets of gold (in ounces) and their market value over the last few days are provided, and you wish to use this to estimate the value of a gold bracelet
The figure shows a scatterplot with the regression line. The data are for the 50 states. The predictor is the percentage of smoke-free homes. The response is the percentage of high school students who smoke. The data came from the Centers for Disease Control and Prevention (CDC).a. Explain what the
The figure shows a scatterplot with a regression line. The data are for the 50 states. The predictor is the percentage of adults who smoke. The response is the percentage of high school students who smoke. (The point in the lower left is Utah.)a. Explain what the trend shows.b. Use the regression
The figure shows a graph of the death rate in automobile accidents and the age of the driver. The numbers came from the Insurance Information Institute.a. Explain what the graph tells us about drivers at different ages; state which ages show the safest drivers and which show the most dangerous
The figure shows mean life expectancy versus age for males and females in the United States in 2009, up to the age of 119. Females are represented by the blue circles and males by the red squares. These figures were reported by the CDC.a. Find your own age on the graph, and estimate your life
The table gives the distance from Boston to each city (in thousands of miles) and gives the time for one randomly chosen, commercial airplane to make that flight. Do a complete regression analysis that includes a scatterplot with the line, interprets the slope and intercept, and predicts how much
This problem concerns the vote of the Ventura County cities on Proposition 227 in June of 1998. Proposition 227 in California stated that children should be taught primarily in English and abolished bilingual education. The statewide vote showed that 61% of the voters were in favor of this
The table gives the number of millionaires (in thousands) and the population (in hundreds of thousands) for the states in the northeastern region of the United States in 2008. The numbers of millionaires come from Forbes Magazine in March of 2007.a. Without doing any calculations, predict whether
The table shows the self-reported number of semesters completed and the number of units completed for 15 students at a community college. All units were counted, but attending summer school was not included.a. Make a scatterplot with the number of semesters on the x-axis and the number of units on
The table shows the number of wins and the number of strike-outs (SO) for 40 baseball pitchers in the major leagues in 2011. (Source: 2011 MLB PITCHING STATS, www.baseball-reference.com/leagues/MLB/2011-pitching-leaders.shtml, accessed via StatCrunch. Owner: IrishBlazeFighter)a. Make a scatterplot
The table shows the number of text messages sent and received by some people in one day. (Source: StatCrunch: Responses to survey. How often do you text? Owner: Webster West. A subset was used.)a. Make a scatterplot of the data, and state the sign of the slope from the scatterplot. Use the number
Answer the questions using complete sentences. a. What is an influential point? b. It has been noted that people who go to church frequently tend to have lower blood pressure than people who don’t go to church. Does this mean you can lower your blood pressure by going to church? Why or why not?
Answer the questions, using complete sentences. a. What is extrapolation and why is it a bad idea in regression analysis? b. How is the coefficient of determination related to the correlation, and what does the coefficient of determination show? c. When testing the IQ of a group of adults (aged 25
Some investors use a technique called the “Dogs of the Dow” to invest. They pick several stocks that are performing poorly from the Dow Jones group (which is a composite of 30 well-known stocks) and invest in these. Explain why these stocks will probably do better than they have done before.
The scatterplot shows the salary and year of first employment for some professors at a college. Explain, in context, what the negative trend shows. Who makes the most and who makes the least?
Suppose a doctor telephones those patients who are in the highest 10% with regard to their recently recorded blood pressure and asks them to return for a clinical review. When she retakes their blood pressures, will those new blood pressures, as a group (that is, on average), tend to be higher
The equation for the regression line relating the salary and the year first employed is given above the figure.a. Report the slope and explain what it means.b. Either interpret the intercept (4,255,000) or explain why it is not appropriate to interpret the intercept.
The figure shows the relationship between the number of miles per gallon on the highway and that in the city for some cars.a. Report the slope and explain what it means.b. Either interpret the intercept (7.792) or explain why it is not appropriate to interpret the intercept.
The table shows the weights and prices of some turkeys at different supermarkets.a. Make a scatterplot with weight on the x-axis and cost on the y-axis. Include the regression line on your scatterplot.b. Find the numerical value for the correlation between weight and price. Explain what the sign of
The figure shows a scatterplot with a regression line for teachers€™ average pay and the expenditure per pupil for each state for public schooling in 2007, according to The 2009 World Almanac and Book of Facts.a. From the graph, is the correlation between teachers€™ average pay
Grades on a political science test and the number of hours of paid work in the week before the test were recorded. The instructor was trying to predict the grade on a test from the hours of work. The figure shows a scatterplot and the regression line for these data.a. Referring to the figure, state
Data were collected that included information on the weight of the trash (in pounds) on the street one week and the number of people who live in the house. The figure shows a scatterplot with the regression line.a. Is the trend positive or negative? What does that mean?b. Now calculate the
The scatterplot shows the average life expectancy for some countries and the number of people per TV in those countries. Comment on the appropriateness of the regression. What do you think accounts for the relationship? Do you think you could raise the life expectancy by buying more TVs? Explain.
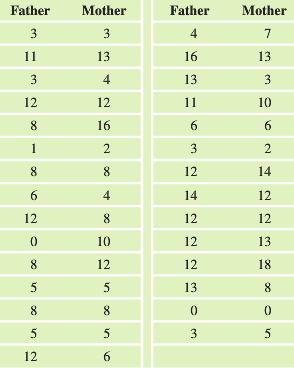
The data shown in the table are the numbers of years of formal education of the fathers and mothers of a sample of 29 statistics students at a small community college in an area with many recent immigrants. (The means are both about 8, and the standard deviations are both about 4.6.) The
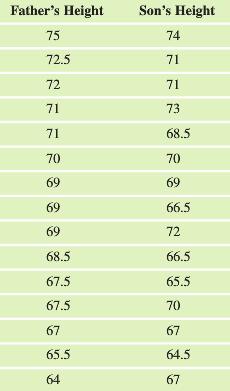
The table shows some data from a sample of heights of fathers and their sons. The scatterplot (not shown) suggests a linear trend.a. Find and report the regression equation for predicting the son€™s height from the father€™s height. Then predict the height of a son with a father 74 inches
Assume that in a political science class, the teacher gives a midterm exam and a final exam. Assume that the association between midterm and final scores is linear. The summary statistics have been simplified for clarity. Midterm: Mean = 75, Standard deviation = 10 Final: Mean = 75, Standard
Assume that in a sociology class, the teacher gives a midterm exam and a final exam. Assume that the association between midterm and final scores is linear. Here are the summary statistics: Midterm: Mean = 72, Standard deviation = 8 Final: Mean = 72, Standard deviation = 8 Also, r = 0.75 and n =
The table shows the heights and weights of some people. The scatterplot shows that the association is linear enough to proceed.Height (inches) Weight (pounds)60 ..............10566 ..............14072 ..............18570 ..............14563 ..............120a. Calculate the correlation, and find
The table shows the heights (in inches) and weights (in pounds) of 14 college men. The scatterplot shows that the association is linear enough to proceed.a. Find the equation for the regression line with weight (in pounds) as the response and height (in inches) as the predictor. Report the slope
The table shows the asking price (in thousands of dollars) and area (square feet) of 30 homes in a town in Texas. (Source: Yahoo Real Estate, accessed via StatCrunch. Owner: Webster West)a. Do a complete analysis of the data (with square feet as the independent variable), including the graph,
At the text€™s website there is a data set that provides the number of calories per 12 ounces of beer and the percentage alcohol for several different brands of beer.a. Refer to the scatterplot that follows. Is a linear analysis appropriate? Why or why not?b. Remove the two low-end outliers
The scatterplot shows the shoe size and height for some men (M) and women (F).a. Why did we not extend the red line (for the women) all the way to 74 inches, instead stopping at 69 inches?b. How do we interpret the fact that the blue line is above the red line?c. How do we interpret the fact that
The scatterplot shows the age in years and the number of hours of sleep for some college men (M) and women (F).a. How do we interpret the fact that both lines have a negative slope?b. How do we interpret the fact that the slopes are the same for both lines?c. How do we interpret the fact that the
a. The figure shows hypothetical data for a group of children. By looking at the figure, state whether the correlation between height and test score is positive, negative, or near zero.b. The shape and color of the each marker show what grade these children were in at the time they took the test.
The price (in dollars) is given for some foods at Target and at Whole Foods. Assume the price at Target is the predictor. (Source: StatCrunch: organic food price comparison fall 2011. Owner: kerrypaulson)a. Make a graph and report whether the trend is linear. If the trend is not linear, comment on
Happiness ratings were from 1 (least happy) to 100 (most happy). Data are at the text’s website. Use age as the independent variable.a. Make a graph and report whether the trend is linear. If the trend is not linear, comment on what it shows, and do not go on to subsequent parts.b. If the graph
Loggers gathered information about some trees. The diameter is in inches, the height is in feet, and the volume of the wood is in cubic feet. Loggers are interested in whether they can estimate the volume of the tree given any single dimension. Which is the better predictor of volume: the diameter
Does education pay? The salary per year in dollars, the number of years employed (YrsEm), and the number of years of education after high school (Educ) for the employees of a company were recorded. Determine whether number of years employed or number of years of education after high school is a
Movie studios exert much effort trying to predict how much money their movies will make. One possible predictor is the amount of money spent on the production of the movie. The table shows the budget and the amount of money made worldwide for the ten movies with the highest profits. The budget
The table gives the number of miles per gallon in the city and on the highway for the coupes and compact cars reported to have the best gasoline mileage, according to autobytel.com. Make a scatterplot, using the city mileage as the predictor. Find the equation of the regression line for predicting
The scatterplot shows information about the world€™s tallest 169 buildings. €œStories€ means €œFloors.€a. What does the trend tell us about the relationship between stories and height (feet)?b. The regression line for predicting the height (in
The scatterplot shows the number of work hours and the number of TV hours per week for some college students who work. There is a very slight trend. Is the trend positive or negative? What does the direction of the trend mean in this context? Identify any unusual points.
To become a lawyer, you must pass the bar exam in your state, and law schools often attract students by advertising their bar-passing rate: the percentage of their graduates who pass the bar exam. What qualities make for a good law school? You might think that a low student/faculty ratio was good;
Construct a small set of numbers with at least three points with a perfect positive correlation of 1.00.For 4.91–4.94 show your points in a rough scatterplot and give the coordinates of the points.
Construct a small set of numbers with at least three points with a perfect negative correlation of -1.00.For 4.91–4.94 show your points in a rough scatterplot and give the coordinates of the points.
Construct a set of numbers (with at least three points) with a strong negative correlation. Then add one point (an influential point) that changes the correlation to positive. Report the data and give the correlation of each set.Show your points in a rough scatterplot and give the coordinates of
Construct a set of numbers (with at least three points) with a strong positive correlation. Then add one point (an influential point) that changes the correlation to negative. Report the data and give the correlation of each set.
The figure shows a scatterplot of the educational level of twins. Describe the scatterplot. Explain the trend and mention any unusual points. (Source: www.stat.ucla.edu)
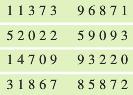
If we flip a coin 10 times, how often do we get 6 or more heads? A first step to answering this question would be to simulate 10 flips. Use the random number table in Appendix A to simulate flipping a coin 10 times. Let odd digits (1, 3, 5, 7, 9) represent heads, and let even digits (0, 2, 4, 6, 8)
Which of the following numbers could not be probabilities, and why? a. 125% b. 0.74 c. 0.001 d. 5.61 e. –150%
Construct a two-way table with 60 women and 80 men in which both groups show equal percentages of right-handedness.
Construct a two-way table with 60 women and 80 men in which there is a higher percentage of right-handed women.
A famous study by Amos Tversky and Nobel laureate Daniel Kahneman asked people to consider two hospitals. Hospital A is small and has 15 babies born per day. Hospital B has 45 babies born each day. Over one year, each hospital recorded the number of days that it had more than 60% girls born.
Suppose a student takes a 10-question multiple-choice quiz, and for each question on the quiz there are five possible options. Only one option is correct. Now suppose the student, who did not study, guesses at random for each question. A passing grade is 3 (or more) correct. We wish to design a
Perform a simulation of a student guessing on a true/false quiz with 10 questions. Use the same four lines of the random number table that are given for the preceding question. Write out each of the seven steps outlined in Section 5.4. Be sure to explain which numbers you will use to represent
A busy street has three traffic lights in a row. These lights are not synchronized, so they run independently of each other. At any given moment, the probability that a light is green is 60%. Assuming that there is no traffic, follow the steps below to design a simulation to estimate the
A soda-bottling plant has a flaw in that 20% of the bottles it fills do not have enough soda in them. The sodas are sold in six-packs. Follow these steps to carry out a simulation to find the probability that three or more bottles in a six-pack will not have enough soda.a. Identify the action with
The General Social Survey (GSS) is a survey done nearly every year at the University of Chicago. One survey, summarized in the table, asked each respondent to report her or his political party affiliation and whether she or he was liberal, moderate, or conservative. (Dem stands for Democrat, and
There are four suits: clubs (♣), diamonds (♦), hearts (♥), and spades (♠), and the following cards appear in each suit: ace, 2, 3, 4, 5, 6, 7, 8, 9, 10, jack, queen, king. The jack, queen, and king are called face cards because they have a drawing of a face on them. Diamonds and hearts are
Refer to the table given in Exercise 5.109.a. If one person is chosen randomly from the group of 1858 people, what is the probability that the person is conservative? b. If one person is chosen randomly from the group of 1858 people, what is the probability that the person is a Republican?
Select someone at random from the 1858 people in the table given in Exercise 5.109. What is the probability that the person is a Democrat OR a Republican?
Select someone at random from the 1858 people in the table given in Exercise 5.109. What is the probability that the person is liberal OR conservative?
Assume one person is chosen randomly from the 1858 people in the table given in Exercise 5.109. What is the probability that the person is liberal OR a Democrat?
Assume that one person is chosen randomly from the table given in Exercise 5.109. What is the probability that the person is conservative OR a Republican?
Referring to the table given in Exercise 5.109, name a pair of mutually exclusive events that could result from selecting an individual at random from this sample.
Refer to Exercise 5.11 for information about cards. If you draw 1 card randomly from a standard 52-card playing deck, what is the probability that it will be? a. A black card? b. A diamond? c. A face card (jack, queen, or king)? d. A nine? e. A king or queen?
Refer to the table for Exercise 5.109.a. Find the probability that a randomly chosen respondent is a Democrat given that he or she is liberal. In other words, what percentage of the liberals are Democrats? b. Find the probability that a randomly chosen respondent is a Democrat given he or she is
Refer to the table for Exercise 5.109.a. Find the probability that a randomly chosen respondent is conservative given that she or he is a Republican.b. Find the probability that a randomly chosen respondent is a Republican given that he or she is conservative.c. Find the probability that a randomly
Let H stand for heads and let T stand for tails in an experiment where a fair coin is flipped twice. Assume that the four outcomes listed are equally likely outcomes: HH, HT, TH, TT What are the probabilities of getting? a. 0 heads? b. Exactly 1 head? c. Exactly 2 heads? d. At least 1 head? e. Not
A hat contains a number of cubes: 15 red, 10 white, 5 blue, and 20 black. One cube is chosen at random. What is the probability that it is?a. A red cube?b. Not a red cube?c. A cube that is white OR black?d. A cube that is neither white nor black?e. What do the answers to part a and part b add up to
The Humane Society of the United States reported that 39% of households owned one or more dogs and 33% owned one or more cats. From this information, is it possible to find the percentage of households that owned a cat OR a dog? Why or why not?
Suppose you discovered that on your college campus, 6% of the female students were married and 4% of the female students had at least one child. a. From this information, is it possible to determine the percentage of female students who were married OR had a child? b. If your answer to part a is
When two people meet, they are sometimes surprised that they have similar beliefs. A survey of 1003 random adults conducted by the Scripps Survey Research Center at Ohio University found that 62 percent of men and 50 percent of women believe in intelligent life on other planets. Well, actually,
The sample space given here shows all possible sequences for a family with 4 children, where B stands for boy and G stands for girl.Assume that all of the 16 outcomes are equally likely. Find the probability of having the following numbers of girls out of 4 children: (a) Exactly 0
Showing 20300 - 20400
of 88243
First
197
198
199
200
201
202
203
204
205
206
207
208
209
210
211
Last
Step by Step Answers
-1.png)
-2.png)
.png)
.png)
.png)
.png)
.png)
.png)
.png)
.png)
.png)
-1.png)
-2.png)
.png)
.png)
.png)
.png)
.png)
.png)
.png)
.png)
.png)
.png)
.png)
.png)
.png)
.png)
.png)
.png)
.png)
.png)
.png)
.png)
.png)
.png)
-1.png)
-2.png)
.png)
.png)
.png)
.png)
.png)
.png)
.png)
.png)
.png)
.png)
.png)
.png)
.png)
.png)
.png)
.png)
.png)
.png)
.png)
.png)

