New Semester
Started
Get
50% OFF
Study Help!
--h --m --s
Claim Now
Question Answers
Textbooks
Find textbooks, questions and answers
Oops, something went wrong!
Change your search query and then try again
S
Books
FREE
Study Help
Expert Questions
Accounting
General Management
Mathematics
Finance
Organizational Behaviour
Law
Physics
Operating System
Management Leadership
Sociology
Programming
Marketing
Database
Computer Network
Economics
Textbooks Solutions
Accounting
Managerial Accounting
Management Leadership
Cost Accounting
Statistics
Business Law
Corporate Finance
Finance
Economics
Auditing
Tutors
Online Tutors
Find a Tutor
Hire a Tutor
Become a Tutor
AI Tutor
AI Study Planner
NEW
Sell Books
Search
Search
Sign In
Register
study help
mathematics
statistics
Introductory Statistics Exploring The World Through Data 2nd Edition Robert Gould, Colleen Ryan - Solutions
The sample shows the possible sequences for flipping three fair coins or flipping one coin three times, where H stands for heads and T stands for tails.Assume that all of the 8 outcomes are equally likely. Find the probability of having exactly the following numbers of heads out of the 3 coins:(a)
What is the probability that a baby will be born on a Friday OR a Saturday OR a Sunday if all the days of the week are equally likely as birthdays?
Cards If one card is selected from a well-shuffled deck of 52 cards, what is the probability that the card will be a club OR a diamond OR a heart? What is the probability of the complement of this event?
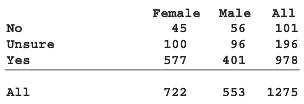
A StatCrunch poll asked people if college was worth the financial investment. They also asked the respondent€™s gender. The table shows a summary of the responses.a. If a person is chosen randomly from the group, what is the probability that the person is male? b. If a person is chosen
Suppose you are carrying out a randomized experiment to test whether loud music interferes with memorizing numbers. You have 20 college student participants. You want each participant to have a 50% chance of being assigned to the experimental group (memorizes numbers while music plays) and a 50%
Refer to the table given for Exercise 5.19.a. If a person is chosen randomly, what is the probability that the person is female?b. If a person is chosen randomly, what is the probability that the person said No?
Refer to the table given for Exercise 5.19.a. If a person is chosen randomly from the group, what is the probability that the person said Yes OR No?b. Are saying Yes and saying No complementary in this data set? Explain.
Refer to the table given for Exercise 5.19.a. If a person is chosen randomly from the group, what is the probability that the person is male OR female?b. Are the events being male and being female complementary? Explain.
Refer to the table given for Exercise 5.19. If a person is chosen randomly from the group, what is the probability that the person is male OR said Yes (or both)? The question was whether college was worth the financial investment.
Refer to the table given for Exercise 5.19. If a person is chosen randomly from the group, what is the probability that the person is female OR said No (or both)?
Suppose a weather forecaster says the probability that it will rain on Saturday is 60% and the probability that it will rain on Sunday is 80%. From this information, is it possible to find the probability that it will rain on Saturday OR Sunday (or both)? Why or why not?
Roll a fair six-sided die. a. What is the probability that the die shows an odd number OR a number less than 3 on top? b. What is the probability that the die shows an odd number OR a number less than 2 on top?
Roll a fair six-sided die. a. What is the probability that the die shows an odd number OR a number greater than 5 on top? b. What is the probability that the die shows an odd number OR a number greater than 4 on top?
Assume that the only grades possible in a history course are A, B, C, and lower than C. The probability that a randomly selected student will get an A in a certain history course is 0.18, the probability that a student will get a B in the course is 0.25, and the probability that a student will get
One of the authors did a survey to determine the effect of students changing answers while taking a multiple-choice test on which there is only one correct answer for each question. Some students erase their initial choice and replace it with another. It turned out that 61% of the changes were from
Suppose that in an election, adults are classified as having voted, being registered to vote but not voting, and not being registered to vote. In one town, 65% of the adults voted and 25% were not registered. What percentage of adults were registered but did not vote?
The mothers of Mrs. Moss's first grade students are in their twenties, thirties, and forties. Suppose that 12% are in their twenties and 58% are in their thirties. What percentage are in their forties?
When a certain type of thumbtack is tossed, the probability that it lands tip up is 60%. All possible outcomes when two thumbtacks are tossed are listed. U means the tip is up, and D means the tip is down. UU UD DU DD a. What is the probability of getting two Ups? b. What is the probability of
When a certain type of thumbtack is tossed, the probability that it lands tip up is 60%, and the probability that it lands tip down is 40%. All possible outcomes when two thumbtacks are tossed are listed. U means the tip is Up, and D means the tip is Down.UU UD DU DDa. What is the
An exam consists of 12 multiple-choice questions. Each of the 12 answers is either right or wrong. Suppose the probability a student makes fewer than 3 mistakes on the exam is 0.48 and the probability that a student makes from 3 to 8 (inclusive) mistakes is 0.30. Find the probability that a student
A driving exam consists of 30 multiple-choice questions. Each of the answers is either right or wrong. Suppose that the probability of making fewer than 7 mistakes is 0.23 and the probability of making from 7 to 15 mistakes is 0.41. Find the probability of making:a. 16 or more mistakesb. 7 or more
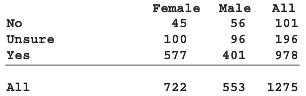
Use the data given in Exercise 5.47.a. Find the probability that a randomly chosen person said Yes given that the person is female. In other words, what percentage of the females said Yes?b. Find the probability that a randomly chosen person said Yes given that the person is male. In other words,
Use the data given in Exercise 5.47.a. Find the probability that a randomly chosen person was female given that the person said Yes. In other words, what percentage of the people who said Yes were female?b. Find the probability that a randomly chosen person who reported being Unsure was female. In
Refer to the table in Exercise 5.47. Suppose a person is randomly selected from this group. Is being female independent of answering YES?
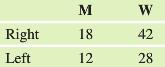
When people fold their hands together with interlocking fingers, most people are more comfortable with one of two ways. In one way, the right thumb ends up on top and in the other way the left thumb is on top. The table shows the data from one group of people. M means man, and W means woman; Right
When two dice are rolled, is the event “the first die shows a 1 on top” independent of the event “the second die shows a 1 on top”?
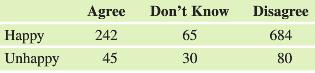
In the 2012 General Social Survey (GSS), people were asked about their happiness and were also asked whether they agreed with the following statement: €œIn a marriage the husband should work, and the wife should take care of the home.€ The table summarizes the data collected.a. Include the
Using the table in Exercise 5.59, determine whether being unhappy is independent of disagreeing with the statement for this sample.
Imagine flipping three fair coins.a. What is the theoretical probability that all three come up heads?b. What is the theoretical probability that the first toss is tails AND the next two are heads?
Imagine rolling a fair six-sided die three times. a. What is the theoretical probability that all three rolls of the die show a 1 on top? b. What is the theoretical probability that the first roll of the die shows a 6 AND the next two rolls both show a 1 on the top.
Florida’s recidivism rate is 33%. This means that about 33% of released prisoners end up back in prison (within three years). Suppose two randomly selected prisoners who have been released are studied.a. What is the probability that both of them go back to prison? What assumptions must you make
Seat belt use in Michigan in 2012 is estimated at 95%, which means 95% of people use their seat belts. Suppose two independent drivers have been randomly selected.a. What is the probability that both of them are using a seatbelt?b. What is the probability that neither of them is using a seatbelt?c.
According to a study published in Scientific American, about 8 women in 100,000 have cervical cancer (which we’ll call event C), so P(C) = 0.00008. Suppose the chance that a Pap smear will detect cervical cancer when it is present is 0.84. Therefore, P(test pos | C) = 0.84 What is the
About 8 women in 100,000 have cervical cancer (C), so P(C) = 0.00008 and P(no C) = 0.99992. The chance that a Pap smear will incorrectly indicate that a woman without cervical cancer has cervical cancer is 0.03. Therefore, P(test pos | no C) = 0.03 What is the probability that a randomly chosen
a. Simulate flipping a coin 20 times. Use the line of random numbers below to obtain and report the resulting list of heads and tails. Use odd numbers (1, 3, 5, 7, 9) for heads and even numbers for tails (0, 2, 4, 6, 8). 1 4 7 0 9 9 3 2 2 0 8 9 5 4 7 9 5 3 2 0 b. Judging on the basis of these 20
Criminal cases are assigned to judges randomly. The list of the criminal judges for Memphis, Tennessee (taken from the Tennessee Court System website, www.tsc.state.tn.us), is given in the table. Assume that only Carolyn Blackett and Paula Skahan are women and the rest are men. If you were a
a. Explain how you could use digits from a random number table to simulate rolling a fair eight-sided die with outcomes 1, 2, 3, 4, 5, 6, 7, and 8 equally likely. Assume that you want to know the probability of getting a 1. b. Carry out your simulation, beginning with line 5 of the random number
Refer to Histograms A, B, and C, which show the relative frequencies from experiments in which a fair six-sided die was rolled. One histogram shows the results for 20 rolls, one the results for 100 rolls, and another the results for 10,000 rolls. Which histogram do you think was for 10,000 rolls,
The table shows the results of rolling a fair six-sided die.Using the table, find the empirical probability of rolling a 1 for 20, 100, and 1000 trials. Report the theoretical probability of rolling a 1 with a fair six-sided die. Compare the empirical probabilities to the theoretical probability,
a. After a large number of flips, the overall proportion of heads €œsettles down€ to nearly what value?b. Approximately how many coin flips does it take before the proportion of heads settles down?c. What do we call the law that causes this settling down of the proportion?d.
Betty and Jane are gambling. They are cutting cards (picking a random place in the deck to see a card). Whichever one has the higher card wins the bet. If the cards have the same value (for example, they are both eights), they try again. Betty and Jane do this 100 times. Tom and Bill are doing the
Consider two pairs of grandparents. The first pair has 4 grandchildren and the second pair has 32 grand-children. Which of the two pairs is more likely to have between 40% and 60% boys as grandchildren, assuming that boys and girls are equally likely as children? Why?
The graph shows the average when a six-sided die is rolled repeatedly. For example, if the first two rolls resulted in a 6 and a 2, the average would be 4. If the next trial resulted in a 1, the new average would be (6 + 2 + 1) / 3 = 3. Explain how the graph demonstrates the Law of Large Numbers.
A study randomly assigned students attending the Air Force Academy to different professors for Calculus I, with equal numbers of students assigned to each professor. Some professors were experienced, and some were relatively inexperienced. Suppose the names of the professors are Peters, Parker,
Some estimates say that 10% of the population is left-handed. We wish to design a simulation to find an empirical probability that if five babies are born on a single day, one or more will be left-handed. Suppose we decide that the even digits (0, 2, 4, 6, 8) will represent left-handed babies and
a. Explain how you could use a random number table (or the random numbers generated by software or a calculator) to simulate rolling a fair four-sided die 20 times. Assume you are interested in the probability of rolling a 1. Then report a line or two of the random number table (or numbers
a. Explain how you could use a random number table to simulate rolling a fair six-sided die 20 times. Assume you wish to find the probability of rolling a 1. Then report a line or two of the random number table (or numbers generated by a computer or calculator) and the values that were obtained
Use your general knowledge to label the following pairs of variables as independent or associated. Explain. a. For a sample of adults, gender and shoe size b. For a sample of football teams, win/loss record for the coin toss at the beginning of the game and number of cheerleaders for the team
Use your general knowledge to label the following pairs of variables as independent or associated. Explain. a. The outcome on flips of two separate, fair coins b. Breed of dog and weight of dog for dogs at a dog show
According to a Gallup poll conducted in 2013, 67% of men support the death penalty in cases of murder, and 59% of women support the death penalty in cases of murder. Suppose these are accurate percentages. Now suppose a random man and a random woman meet. a. What is the probability that they both
According to a Gallup conducted poll in 2012, 64% of men and 66% of women believe that gay and lesbian relationships should be legal. Suppose these are accurate percentages. Now suppose a random man and a random woman meet. a. What is the probability that they both believe that gay and lesbian
A 2013 Pew poll said that 93% of young adults in the United States have Internet access. Assume that this is still correct. a. If two people are randomly selected, what is the probability that they both have Internet access? b. If the two people chosen were a married couple living in the same
The probability of a randomly selected person having a grade of 500 or above on the quantitative portion of the SAT is 0.50. a. If two students are chosen randomly and independently, what is the probability that they both score 500 or above? b. If two students are selected from the same high school
Suppose all the days of the week are equally likely as birthdays. Alicia and David are two randomly selected, unrelated people. a. What is the probability that they were both born on Monday? b. What is the probability that Alicia OR David was born on Monday?
In California, about 92% of teens who take the written driver’s exam fail the first time they take it (www.teendrivingcourse.com). Suppose that Sam and Maria are randomly selected teenagers taking the test for the first time.a. What is the probability that they both pass the test?b. What is the
A Gallup poll asked, “Do you think that rich people in America today are happier than you, less happy, or about the same?” In 2012, 27% said less happy, 11% said happier, and 57% said about the same. The reason these don’t add to 100% is that there were some people who had no opinion. Suppose
A Gallup poll asked, “Do you think that rich people in America today are happier than you, less happy, or about the same?” In 1990, 36% said less happy, 11% said hap-pier, and 50% said about the same. The reason these don’t add up to 100% is that there were some people who had no opinion.
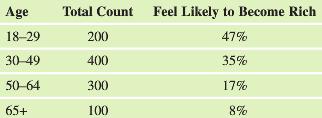
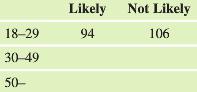
A Gallup poll conducted in 2012 asked people who were not rich whether they thought it was likely that they would become rich. The table gives the total number of people in each age range (rounded) and the percent who said they were likely to become rich.a. Make a two-way table of counts (not
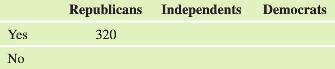
A Gallup poll conducted in 2012 asked people, €œDo you think the United States benefits from having a class of rich people?€ In response, 80% of Republicans, 59% of Independents, and 52% of Democrats said Yes. Assume that any-one who did not answer Yes answered No. Suppose the number of
In Virginia, in 2010, re-arrests occurred within one year for 46% of juveniles released from a correction center. Suppose there are two independent juveniles released. Assume that re-arrests are independent for released juveniles. a. What is the probability that they are both re-arrested? b. What
In California, the recidivism rate for prisoners is 67.5%. That is, 67.5% of those released from prison go back to prison within three years. This is one of the highest recidivism rates in the nation.a. Suppose two independent prisoners are released. What is the probability that they will both go
a. From your answers in Exercise 6.8, find the probability of getting 0 heads, 1 head, or 2 heads when flipping a fair coin twice, and report the distribution in a table.b. Make a probability distribution graph of this.
Eric wants to go skiing tomorrow, but only if there are 3 inches or more of new snow. According to the weather report, any amount of new snow between 1 inch and 6 inches is equally likely. The probability density curve for tomorrow€™s new snow depth is shown. Find the probability that the
Refer to Exercise 6.11. What is the probability that the amount of new snow will be between 2 and 4 inches? Copy the graph from Exercise 6.11, shade the appropriate area, and report the numerical value of the probability.In exercise
The Empirical Rule applies rough approximations to probabilities for any unimodal, symmetric distribution. But for the Normal distribution we can be more precise. Use the figure and the fact that the Normal curve is symmetric to answer the questions. Do not use a Normal table or
Wechsler IQs are approximately Normally distributed with a mean of 100 and a standard deviation of 15. Use the probabilities shown in the figure in Exercise 6.13 to answer the following questions. Do not use the Normal table or technology. You may want to label the figure with Empirical Rule
Quantitative SAT scores are approximately Normally distributed with a mean of 500 and a standard deviation of 100. On the horizontal axis of the graph, indicate the SAT scores that correspond with the provided z-scores. Answer the questions using only your knowledge of the Empirical Rule and
Assume that college women's heights are approximately Normally distributed with a mean of 65 inches and a standard deviation of 2.5 inches. On the horizontal axis of the graph, indicate the heights that correspond to the z-scores provided. (Use only the Empirical Rule to choose your answers. Sixty
Use a table or technology to answer each question. Include an appropriately labeled sketch of the Normal curve for each part. Shade the appropriate region.a. Find the area to the left of a z-score of -0.50.b. Find the area to the right of a z-score of -0.50.
Use a table or technology to answer each question. Include an appropriately labeled sketch of the Normal curve for each part. Shade the appropriate region.a. Find the probability that a z-score will be 1.76 or less.b. Find the probability that a z-score will be 1.76 or more.c. Find the probability
Use a table or technology to answer each question. Include an appropriately labeled sketch of the Normal curve for each part. Shade the appropriate region.a. Find the probability that a z-score will be -1.00 or less.b. Find the probability that a z-score will be more than -1.00.c. Find the
For each question, find the area to the right of the given z-score in a standard Normal distribution. In this question, round your answers to the nearest 0.000.Include an appropriately labeled sketch of the N(0, 1) curve.a. z = 4.00b. z = 10.00 (Hint: Should this tail proportion be larger or
For each question, find the area to the right of the given z-score in a standard Normal distribution. In this question, round your answers to the nearest 0.000.Include an appropriately labeled sketch of the N(0, 1) curve.a. z = -4.00b. z = -8.00c. z = -30.00d. If you had the exact probability for
According to data from the College Board, the mean quantitative SAT score for female college-bound high school seniors in 2012 was 500. Assume that SAT scores are approximately normally distributed with a population standard deviation of 100. What percentage of female college-bound students had
According to data from the College Board, the mean quantitative SAT score for male college-bound high school seniors in 2012 was 530. Assume that SAT scores are approximately normally distributed with a population standard deviation of 100. If a male college-bound high school senior is selected at
Stanford–Binet IQ scores for children are approximately normally distributed and have µ = 100 and σ = 15. What is the probability that a randomly selected child will have an IQ below 115?
Stanford–Binet IQs for children are approximately Normally distributed and have µ = 100 and σ = 15. What is the probability that a randomly selected child will have an IQ of 115 or above?
According to National Vital Statistics, the average length of a newborn baby is 19.5 inches with a standard deviation of 0.9 inch. The distribution of lengths is approximately Normal. Use a table or technology for each question. Include an appropriately labeled and shaded Normal curve for each
The distribution of white blood cell count per cubic millimeter of whole blood is approximately Normal with mean 7500 and standard deviation 1750 for healthy patients. Include an appropriately labeled and shaded Normal curve for each part. There should be three separate curves.a. What is the
The distribution of red blood cell counts is different for men and women. For both, the distribution is approximately Normal. For men, the middle 95% range from 4.5 to 5.7 million cells per microliter, and for women, the middle 95% have red blood cell counts between 3.9 and 5.0 million cells per
Answer the previous question for the women.The distribution of red blood cell counts is different for men and women. For both, the distribution is approximately Normal. For men, the middle 95% range from 4.5 to 5.7 million cells per microliter, and for women, the middle 95% have red blood cell
In Alaska in 2010, the average critical reading SAT score was 518. Assume that the standard deviation is 100 and that SAT scores are normally distributed. Include an appropriately labeled and shaded Normal curve for each part.a. What percentage of SAT takers in Alaska scored 500 or less?b. What
In Connecticut in 2010, the average critical reading SAT score was 509. Assume that the standard deviation is 100 and that SAT scores are normally distributed. Include an appropriately labeled and shaded Normal curve for each part.a. What percentage of SAT takers in Connecticut scored 600 or
In New Jersey in 2010, the average critical reading SAT score was 495. Assume that the standard deviation is 100 and that SAT scores are normally distributed. Include an appropriately labeled and shaded Normal curve for each part.a. What percentage of SAT takers in New Jersey scored between 450 and
In Texas in 2010, the average critical reading SAT score was 484. Assume that the standard deviation is 100 and that SAT scores are normally distributed. Include an appropriately labeled and shaded Normal curve for each part.a. What percentage of SAT takers in Texas scored between 400 and 500?b.
New York City’s mean minimum daily temperature in February is 27°F (www.ny.com). Suppose the standard deviation of the minimum temperature is 6°F and the distribution of minimum temperatures in February is approximately Normal. What percentage of days in February has minimum temperatures below
Assume for this question that college women€™s heights are approximately normally distributed with a mean of 64.6 inches and a standard deviation of 2.6 inches. Draw a well-labeled Normal curve for each part.a. Find the percentage of women who should have heights of 63.5 inches or less.b. In a
According to the College Board, the mean quantitative SAT score for female college-bound high school seniors in 2012 was 500. SAT scores are approximately normally distributed with a population standard deviation of 100. A scholarship committee wants to give awards to college-bound women who score
According to the College Board, the mean quantitative SAT score for male college-bound high school seniors in 2012 was 530. SAT scores are approximately Normally distributed with a population standard deviation of 100. What is the SAT score at the 96th percentile for male college-bound seniors?
Suppose there is a club for tall people that requires that women be at or above the 98th percentile in height. Assume that women’s heights are distributed as N (64, 2.5). Find what women’s height is the minimum required for joining the club, rounding to the nearest inch. Draw a well-labeled
Suppose there is a club for tall people that requires that men be at or above the 98th percentile in height. Assume that men’s heights are distributed as N (69, 3). Find what men’s height is the minimum required for joining the club, rounding to the nearest inch. Draw a well-labeled sketch to
Suppose college women’s heights are approximately normally distributed with a mean of 65 inches and a population standard deviation of 2.5 inches. What height is at the 20th percentile? Include an appropriately labeled sketch of the Normal curve to support your answer.
A magician has shaved an edge off one side of a six-sided die, and as a result, the die is no longer €œfair.€ The figure shows a graph of the probability density function (pdf). Show the pdf in table format by listing all six possible outcomes and their probabilities.
Suppose college men’s heights are approximately normally distributed with a mean of 70.0 inches and a population standard deviation of 3 inches. What height is at the 20th percentile? Include an appropriately labeled Normal curve to support your answer.
Critical reading SAT scores are distributed as N(500, 100).a. Find the SAT score at the 75th percentile.b. Find the SAT score at the 25th percentile.c. Find the interquartile range for SAT scores.d. Is the interquartile range larger or smaller than the standard deviation? Explain.
College women have heights with the following distribution (inches): N (65, 2.5).a. Find the height at the 75th percentile.b. Find the height at the 25th percentile.c. Find the interquartile range for heights.d. Is the interquartile range larger or smaller than the standard deviation? Explain.
According to the National Health Center, the heights of 6-year-old girls are normally distributed with a mean of 45 inches and standard deviation of 2 inches.a. In which percentile is a 6-year-old girl who is 46.5 inches tall?b. If a 6-year-old girl who is 46.5 inches tall grows up to be a woman at
According to the National Health Center, the heights of 5-year-old boys are Normally distributed with a mean of 43 inches and standard deviation of 1.5 inches.a. In which percentile is a 5-year-old boy who is 46.5 inches tall?b. If a 5-year-old boy who is 46.5 inches tall grows up to be a man at
The average birth weight of domestic cats is about 3 ounces. Assume that the distribution of birth weights is Normal with a standard deviation of 0.4 ounce.a. Find the birth weight of cats at the 90th percentile.b. Find the birth weight of cats at the 10th percentile.
The average birth weight of elephants is 230 pounds. Assume that the distribution of birth weights is Normal with a standard deviation of 50 pounds. Find the birth weight of elephants at the 95th percentile.
Showing 20400 - 20500
of 88243
First
198
199
200
201
202
203
204
205
206
207
208
209
210
211
212
Last
Step by Step Answers
.png)
.png)


.png)
.png)

.png)
.png)
.png)
.png)
.png)
.png)
.png)
.png)
.png)
.png)
.png)
.png)
.png)

