New Semester
Started
Get
50% OFF
Study Help!
--h --m --s
Claim Now
Question Answers
Textbooks
Find textbooks, questions and answers
Oops, something went wrong!
Change your search query and then try again
S
Books
FREE
Study Help
Expert Questions
Accounting
General Management
Mathematics
Finance
Organizational Behaviour
Law
Physics
Operating System
Management Leadership
Sociology
Programming
Marketing
Database
Computer Network
Economics
Textbooks Solutions
Accounting
Managerial Accounting
Management Leadership
Cost Accounting
Statistics
Business Law
Corporate Finance
Finance
Economics
Auditing
Tutors
Online Tutors
Find a Tutor
Hire a Tutor
Become a Tutor
AI Tutor
AI Study Planner
NEW
Sell Books
Search
Search
Sign In
Register
study help
mathematics
statistics
Introductory Statistics Exploring The World Through Data 2nd Edition Robert Gould, Colleen Ryan - Solutions
Explain the difference between sampling with replacement and sampling without replacement. Suppose you have the names of 10 students, each written on a 3 by 5 notecard, and want to select two names. Describe both procedures.
According to Time magazine (June 11, 2012), the dropout rate for all college students with loans is 30%. Suppose that 65 out of 200 random college students with loans drop out.a. Give the null and alternative hypotheses to test that the dropout rate is not 30%. b. Report the test statistic (z) from
Suvs According to Time magazine (June 11, 2012), 33% of all cars sold in the United States are SUVs. Suppose a random sample of 500 recently sold cars shows that 145 are SUVs.a. Write the null and alternative hypotheses to test that fewer than 33% of cars sold are SUVs. b. Report the value of the
Refer to Exercise 8.3. Suppose 100 people attend boot camp and 44 of them return to prison within three years). The population recidivism rate for the whole state is 40%. a. What is p`, the sample proportion of successes? (It is somewhat odd to call returning to prison a success.) b. What is p0,
Refer to Exercise 8.4. Suppose a sample of 600 surgeries with the new scrub shows 18 infections. Find the value of the test statistic, z, and explain its meaning in context. The old infection rate was 4%.
Suppose you are testing someone to see whether she or he can tell Coke from Pepsi, and you are using 20 trials, half with Coke and half with Pepsi. The null hypothesis is that the person is guessing.a. About how many should you expect the person to get right under the null hypothesis that the
St. Louis County is 24% African American. Suppose you are looking at jury pools, each with 200 members, in St. Louis County. The null hypothesis is that the probability of an African American being selected into the jury pool is 24%.a. How many African Americans would you expect on a jury pool
Suppose we are testing people to see if the rate of use of seat belts has changed from a previous value of 88%. Suppose that in our random sample of 500 people, we see that 450 have the seat belt fastened.a. About how many out of 500 would we expect to be using their seat-belts if the proportion
A 20-question multiple choice quiz has five choices for each question. Suppose that a student just guesses, hoping to get a high score. The teacher carries out a hypothesis test to determine whether the student was just guessing. The null hypothesis is p = 0.20, where p is the probability of a
A 2003 study of dreaming found that out of a random sample of 113 people, 92 reported dreaming in color. However, the proportion of people who reported dreaming in color that was established in the 1940s was 0.29 (Schwitzgebel 2003). Check to see whether the conditions for using a one-proportion
About 30% of the population in Silicon Valley, a region in California, are between the ages of 40 and 65, according to the U.S. Census. However, only 2% of the 2100 employees at a laid-off man’s former Silicon Valley Company are between the ages of 40 and 65. Lawyers might argue that if the
When asked whether marriage is becoming obsolete, 782 out of 2004 randomly selected adults answering a Pew Poll said yes. We are testing the hypothesis that the population proportion that believes marriage is becoming obsolete is more than 38% using a significance level of 0.05. One of the
According to Time magazine (December 5, 2011), 18% of adult Americans suffer from an anxiety disorder. Suppose a test of 300 random college students showed that 50 suffered from an anxiety disorder.a. How many out of 300 would you expect to have an anxiety disorder if the 18% is correct?b. Suppose
According to Time magazine (May 28, 2012), 33% of people in the United States have sleep-walked at least once in their lives. Suppose a random sample of 200 people showed that 42 reported sleepwalking. Carry out the first two steps of a hypothesis test that will test whether the proportion of
The percentage of female CEOs in 2013 in Fortune 500 companies was 4%, according to Time magazine (March 18, 2013). Suppose a student did a survey of 250 randomly selected large companies (not Fortune 500 companies), and 15 of them had women CEOs.a. About how many of the 250 should we expect to
According to Time magazine (May 28, 2012), 33% of people in the U.S. have sleep-walked at least once in their lives. Suppose a random sample of 200 people showed that 42 reported sleepwalking. The first two steps were asked for in Exercise 8.29. Use the computer output provided to carry out the
The percentage of female CEOs in 2013 in Fortune 500 companies was 4%, according to Time Magazine (March 18, 2013). Suppose a student did a survey of 250 randomly selected large companies (not Fortune 500 companies), and 15 of them had women CEOs. In Exercise 8.30 you carried out the first two
For each graph, indicate whether the shaded area could represent a p-value. Explain why or why not. If yes state whether the area could represent the p-value for a one-sided or a two-sided alternative hypothesis.
Historically, the percentage of U.S. residents who support stricter gun control laws has been 52%. A recent Gallup Poll of 1011 people showed 495 in favor of stricter gun control laws. Assume the poll was given to a random sample of people. Test the claim that the proportion of those favoring
A Pew Poll in November 2011 showed that 1241 out of 2001 randomly polled people favor the death penalty for those convicted of murder.a. Test the hypothesis that more than half of people favor the death penalty using a significance level of 0.05. Label each step.b. If there were a vote by the
Historically (from about 2001 to 2005), about 58% of Americans believed that Earth’s temperature was rising (“global warming”). A March 2010 Gallup Poll sought to determine whether this proportion had changed. The poll interviewed 1014 adult Americans, and 527 said they believed that global
According to one source, 50% of plane crashes are due at least in part to pilot error (www.planecrash-info.com). Suppose that in a random sample of 100 separate air-plane accidents, 62 of them were due to pilot error (at least in part.)a. Test the null hypothesis that the proportion of airplane
Some experts believe that 20% of all freshwater fish in the United States have such high levels of mercury that they are dangerous to eat. Suppose a fish market has 250 fish tested, and 60 of them have dangerous levels of mercury. Test the hypothesis that this sample is not from a population with
Suppose a poll is taken that shows that 281 out of 500 randomly selected, independent people believe the rich should pay more taxes than they do. Test the hypothesis that a majority (more than 50%) believe the rich should pay more taxes than they do. Use a significance level of 0.05.
Samuel Morse determined that the percentage of t’s in the English language in the 1800s was 9%. A random sample of 600 letters from a current newspaper contained 48 t’s. Using the 0.10 level of significance, test the hypothesis that the proportion of t’s in this modern newspaper is 0.09.
Samuel Morse determined that the percentage of a’s in the English language in the 1800s was 8%. A random sample of 600 letters from a current newspaper contained 60 a’s. Using the 0.10 level of significance, test the hypothesis that the proportion of t’s in this modern newspaper is 0.09.
A test is conducted in which a coin is flipped 30 times to test whether the coin is unbiased. The null hypothesis is 7 that the coin is fair. The alternative is that the coin is not fair. One of the accompanying figures represents the p-value after getting 16 heads out of 30 flips, and the other
Suppose you are spinning pennies to test whether you get biased results. When you reject the null hypothesis when it is actually true, that is often called the first kind of error. The second kind of error is when the null is false and you fail to reject. Report the first kind of error and the
Suppose you are testing someone to see whether he or she can tell butter from margarine when it is spread on toast. You use many bite-sized pieces selected randomly, half from buttered toast and half from toast with margarine. The taster is blindfolded. The null hypothesis is that the taster is
A person spinning a 1962 penny gets 10 heads out of 50 spins. Because she gets a p-value of 0.00002, she says she has proved the coin is biased. What is the flaw in the statement and how would you correct it?
The null hypothesis on true/false tests is that the student is guessing, and the proportion of right answers is 0.50. A student taking a five-question true/false quiz gets 4 right out of 5. She says that this shows that she knows the material, because the one-tailed p-value from the one-proportion
A proponent of a new proposition on a ballot wants to know whether the proposition is likely to pass. Suppose a poll is taken, and 580 out of 1000 randomly selected people support the proposition. Should the proponent use a hypothesis test or a confidence interval to answer this question? Explain.
A proponent of a new proposition on a ballot wants to know the population percentage of people who support the bill. Suppose a poll is taken, and 580 out of 1000 randomly selected people support the proposition. Should the proponent use a hypothesis test or a confidence interval to answer this
If we do not reject the null hypothesis, is it valid to say that we accept the null hypothesis? Why or why not?
When comparing two sample proportions with a two-sided alternative hypothesis, all other factors being equal, will you get a smaller p-value if the sample proportions are close together or if they are far apart? Explain.
CLL Furman et al. (2014) reported on a study of patients with recurring chronic lymphocytic leukemia (CLL). The study was randomized, double-blind, and placebo-controlled. After 12 months, 101 of the 110 patients assigned to the combination treatment of idelalisib (idel) with rituximab (rit) were
A vaccine to prevent severe rotavirus gastroenteritis (diarrhea) was given to African children within the first year of life as part of a drug study. The study reported that of the 3298 children randomly assigned the vaccine, 63 got the virus. Of the 1641 children randomly assigned the placebo, 80
A study used nicotine gum to help people quit smoking. The study was placebo-controlled, randomized, and double-blind. Each participant was interviewed after 28 days, and success was defined as being abstinent from cigarettes for 28 days. The results showed that 174 out of 1649 people using the
Shankaran and colleagues (2012) reported the results of a randomized trial of whole-body hypothermia (cooling) for neonatal hypoxic–ischemic encephalopathy (brain problems in babies due to lack of oxygen). Twenty-seven of the 97 infants randomly assigned to hypothermia died and 41 of the 93
In London, Ontario, Canada, investigators (Leschied and Cunningham 2002) performed a randomized experiment in which 409 juvenile delinquents were randomly assigned to either multisystemic therapy (MST) or just probation (control group). Of the 211 assigned to therapy, 87 had criminal convictions
Feder and Dugan (2002) reported a study in which 404 domestic violence defendants were randomly assigned to counseling and probation (the experimental group) or just probation (the control group). Out of 230 people in the counseling group, 55 were arrested within 12 months. Out of 174 people
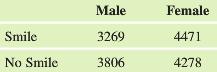
In a 1997 study, people were observed for about 10 seconds in public places, such as malls and restaurants, to determine whether they smiled during the randomly chosen 10-second interval. The table shows the results for comparing males and females.a. Find and compare the sample percentages of women
Refer to the study discussed in Exercise 8.69. The accompanying table shows the results of the study for different age groups.a. For each age group, find the percentage who were smiling.b. Treat this as a random sample of people, and merge the groups 0€“10 and 11€“20 into one age group
For each of the following, state whether a one-proportion z-test or a two-proportion z-test would be appropriate, and name the populations. a. A student watches a random sample of men and women leaving a Milwaukee supermarket with carts to see whether they put the carts back in the designated area.
Give the null and alternative hypotheses for each test, and state whether a one-proportion z-test or a two-proportion z-test would be appropriate. a. You test a person to see whether he can tell tap water from bottled water. You give him 20 sips selected randomly (half from tap water and half from
In each case, choose whether the appropriate test is a one-proportion z-test or a two-proportion z-test. Name the population(s). a. A researcher takes a random sample of 4-year-olds to find out whether girls or boys are more likely to know the alphabet. b. A pollster takes a random sample of all
A student who claims he can tell cola A from cola B is blindly tested with 20 trials. At each trial, cola A or cola B is randomly chosen and presented to the student, who must correctly identify the cola. The experiment is designed so that the student will have exactly 10 sips from each cola. He
A man is tested to determine whether he can tell butter from margarine. He is blindfolded and given small bites of English muffin to identify. At each trial, an English muffin with either butter or margarine is randomly chosen. The experiment is designed so that he will have exactly 15 bites with
Mary was tested to see whether she could tell peppermint gum from spearmint gum by smell alone. She got 12 right out of 20, and the p-value was 0.186. Explain what is wrong with the following conclusion, and write a correct conclusion: “We proved that Mary cannot tell the difference between
The Gallup organization frequently conducts polls in which they ask the following question:“In general, do you feel that the laws covering the sale of fire-arms should be made more strict, less strict, or kept as they are now?”In February 1999, 60% of those surveyed said “more strict,” and
Many polls have asked people whether they are trying to lose weight. A Gallup Poll in November of 2008 showed that 22% of men said they were seriously trying to lose weight. In 2006, 24% of men (with the same average weight of 194 pounds as the men polled in 2008) said they were seriously trying to
In June 30, 2012, the Ventura County Star reported that 63% of employers allow employees to work from home sometimes (this is up from 34% in 2005). Suppose a random sample of 400 employers shows that 235 allow some work from home. Test the hypothesis that the percentage is not 63%, using a
In 2012 the Ventura County Star reported that 77% of employers allow employees to use flex time and periodically change their start and quit times (this is up from 66% in 2005). Suppose a random sample of 200 employers shows that 130 allow flex time. Test the hypothesis that the percentage is less
A poll in California (done by the Public Policy Institute) asked whether the government should regulate greenhouse gases, and 751 out of 1138 likely voters said yes. However, when a different polling agency asked whether stricter environmental controls are worth the cost, 523 of 1138 likely voters
A Washington Post Poll (March 18, 2013) and a Pew Poll (March 17, 2013) both claimed to ask a random sample of adults in the United States whether they supported or opposed gay marriage. In the Washington Post Poll, 581 supported and 360 opposed gay marriage. In the Pew Poll, 735 supported and 660
The average income in Connecticut in 2013 was $60,000 per person per year, and that was larger than the average for any other state but smaller than the District of Columbia. Suppose the standard deviation is $30,000 and the distribution is right-skewed. Suppose we take a random sample of 400
Some sources report that the weights of full-term newborn babies have a mean of 7 pounds and a standard deviation of 0.6 pound and are Normally distributed. a. What is the probability that one newborn baby will have a weight within 0.6 pound of the mean-that is, between 6.4 and 7.6 pounds, or
Some sources report that the weights of full-term newborn babies have a mean of 7 pounds and a standard deviation of 0.6 pound and are normally distributed. In the given outputs, the shaded areas (reported as p =) represent the probability that the mean will be larger than 7.6 or smaller than 6.4.
The average income in the District of Columbia in 2013 was $76,000 per person per year. Suppose the standard deviation is $35,000 and the distribution is right skewed. Suppose we take a random sample of 100 residents of D.C. a. Is the sample size large enough to use the Central Limit Theorem for
The average income in Connecticut in 2013 was $60,000 per person per year. Suppose the standard deviation is $30,000 and the distribution is right-skewed. Suppose we take a random sample of 400 residents of Connecticut. We want to find the probability that the sample mean will be more than $3000
One of the histograms is a histogram of a sample (from a population with a skewed distribution) one is the distribution of many means of repeated random samples of size 5, and one is the distribution of repeated means of random samples of size 25; all the samples are from the same population. State
The mean age of all 638 used cars for sale in the Ventura Country Star one Saturday in 2013 was 7.9 years, with a standard deviation of 7.7 years. The distribution of ages is right-skewed. For a study to determine the reliability of classified ads, a reporter randomly selects 40 of these used cars
The mean age of all 2550 students at a small college is 22.8 years with a standard deviation is 3.2 years, and the distribution is right-skewed. A random sample of 4 students' ages is obtained, and the mean is 23.2 with a standard deviation of 2.4 years. a. µ =? σ =? x =? s =? b. Is m a parameter
A random sample of 10 colleges from Kiplinger’s 100 Best Values in Public Education was taken. The mean rate of graduation within four years was 43.5% with a margin of error of 6.0%. The distribution of graduation rates is Normal. a. Decide whether each of the following statements is worded
A random sample of 10 colleges from Kiplinger’s 100 Best Values in Public Education was taken. The mean debt after graduation was $18,546 with a margin of error of $1398. The distribution of debts is Normal.a. Decide whether each of the following statements is worded correctly for the confidence
A statistics instructor randomly selected four bags of oranges; each bag labeled 10 pounds, and weighed the bags. They weighed 10.2, 10.5, 10.3, and 10.3 pounds. Assume that the distribution of weights is Normal. Find a 95% confidence interval for the mean weight of all bags of oranges. Use
The weights of four randomly chosen bags of horse carrots, each bag labeled 20 pounds, were 20.5, 19.8, 20.8, and 20.0 pounds. Assume that the distribution of weights is Normal. Find a 95% confidence interval for the mean weight of all bags of horse carrots. Use technology for your calculations.a.
A random sample of 10 colleges from Kiplinger€™s 100 Best Values in Public Education was taken. A 95% confidence interval for the mean admission rate was (52.8%, 75.0%). The rates of admission were normally distributed. Which of the following statements is a correct interpretation of the
A researcher collects a sample of 25 measurements from a population and wants to find a 99% confidence interval.a. What value should he use for t*? (Recall that df = n - 1 for a one-sample t-interval.) Use the table given for Exercise 9.25.b. Why is the answer to this question larger than the
A hamburger chain sells large hamburgers. When we take a sample of 30 hamburgers and weigh them, we find that the mean is 0.51 pounds and the standard deviation is 0.2 pound.a. State how you would fill in the numbers below to do the calculation with Minitab.b. Report the confidence interval in a
A fast-food chain sells drinks that they call HUGE. When we take a sample of 25 drinks and weigh them, we find that the mean is 36.3 ounces with a standard deviation of 1.5 ounces.a. State how you would fill in the numbers below to do the calculation with a TI-84.b. Report the confidence interval
A random sample of 25 men’s resting pulse rates shows a mean of 72 beats per minute and a standard deviation of 13.a. Find a 95% confidence interval for the population mean pulse rate for men, and report it in a sentence. You may use the table given for Exercise 9.25.b. Find a 99% confidence
The distribution of the scores on a certain exam is N(70, 10), which means that the exam scores are Normally distributed with a mean of 70 and standard deviation of 10.a. Sketch the curve and label, on the x-axis, the position of the mean, the mean plus or minus one standard deviation, the mean
A random sample of 100 women from the General Social Survey showed that the mean number of children reported was 1.85 with a standard deviation of 1.5. (Interestingly, a sample of 100 men showed a mean of 1.49 children.)a. Find a 95% confidence interval for the population mean number of children
In finding a confidence interval for a random sample of 30 students GPAs, one interval was (2.60, 3.20) and the other was (2.65, 3.15). a. One of them is a 95% interval and one is a 90% interval. Which is which, and how do you know? b. If we used a larger sample size (n = 120 instead of n = 30),
In Exercise 9.31, two intervals were given for the same data, one for 95% confidence and one for 90% confidence. a. How would a 99% interval compare? Would it be narrower than both, wider than both, or between the two in width. Explain. b. If we wanted to use a 99% confidence level and get a
State whether each of the following changes would make a confidence interval wider or narrower. (Assume that nothing else changes.) a. Changing from a 90% confidence level to a 99% confidence level. b. Changing from a sample size of 30 to a sample size of 200. c. Changing from a standard deviation
State whether each of the following changes would make a confidence interval wider or narrower. (Assume that nothing else changes.) a. Changing from a 95% level of confidence to a 90% level of confidence. b. Changing from a sample size of 30 to a sample size of 20. c. Changing from a standard
The weights of four randomly and independently selected bags of potatoes labeled 20 pounds were found to be 21.0, 21.5, 20.5, and 21.2 pounds. Assume Normality.a. Find a 95% confidence interval for the mean weight of all bags of potatoes.b. Does the interval capture 20.0 pounds? Is there enough
The weights of four randomly and independently selected bags of tomatoes labeled 5 pounds were found to be 5.1, 5.0, 5.3, and 5.1 pounds. Assume Normality.a. Find a 95% confidence interval for the mean weight of all bags of tomatoes.b. Does the interval capture 5.0 pounds? Is there enough evidence
A random sample of 10 independent healthy people showed the following body temperatures (in degrees Fahrenheit):98.5, 98.2 99.0, 96.3, 98.3, 98.7, 97.2, 99.1, 98.7, 97.2Test the hypothesis that the population mean is not 98.6°F, using a significance level of 0.05. See page 474 for guidance.
Data on the disk and website show reaction distances in centimeters for the dominant hand for a random sample of 40 independently chosen college students.Smaller distances indicate quicker reactions.a. Make a graph of the distribution of the sample, and describe its shape.b. Find, report, and
Use the data from Exercise 9.35.In exerciseThe weights of four randomly and independently selected bags of potatoes labeled 20 pounds were found to be 21.0, 21.5, 20.5, and 21.2 pounds. Assume Normality.a. Find a 95% confidence interval for the mean weight of all bags of potatoes.b. Does the
The distribution of the scores on a certain exam is N(70, 10), which means that the exam scores are Normally distributed with a mean of 70 and standard deviation of 10. a. Sketch the curve and label, on the x-axis, the position of the mean, the mean plus or minus one standard deviation the mean
Use the data from Exercise 9.36.a. Using the four-step procedure with a two-sided alternative hypothesis, should you be able to reject the hypothesis that the population mean is 5 pounds using a significance level of 0.05? Why or why not? The confidence interval is reported here: I am 95% confident
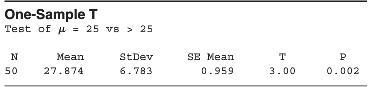
In the U.S. Department of Health has suggested that a healthy total cholesterol measurement should be 200 mg/dL or less. Records from 50 randomly and independently selected people from the NHANEs study showed the results in the Minitab output given:Test the hypothesis that the mean cholesterol
A body mass index of more than 25 is considered unhealthful. The Minitab output given is from 50 randomly and independently selected people from the NHANES study.
In the United States, the population mean height for 3-year-old boys is 38 inches (www.kidsgrowth.com). Suppose a random sample of 15 non-U.S. 3-year-old boys showed a sample mean of 37.2 inches with a standard deviation of 3 inches. The boys were independently sampled. Assume that heights are
The mean weight of all 20-year old women is 128 pounds (www.kidsgrowth.com). A random sample of 40 vegetarian women who are 20 years old showed a sample mean of 122 pounds with a standard deviation of 15 pounds. The women's measurements were independent of each other.a. Determine whether the mean
Thirty GPAs from a randomly selected sample of statistics students at Oxnard College are available at this text's website. Assume that the population distribution is approximately Normal. The technician in charge of records claimed that the population mean GPA for the whole college is 2.81.a. What
A random sample of 20 independent female college-aged dancers was obtained, and their heights (in inches) were measured. Assume the population distribution is Normal.a. What is the sample mean? Is it above or below 64.5 inches?b. Some people claim that the physical demands on dancers are such that
Using the data from Exercise 9.45 on GPAs, find a 95% confidence interval for the mean GPA. Also, if you had used a two-sided alternative (instead of the one-sided alternative in Exercise 9.45) and had done a test with a significance level of 0.05, would you have rejected a hypothesized mean GPA of
Using the data from Exercise 9.46 on dancers’ heights, find a 95% confidence interval for the mean height. Also, if you had used a two-sided alternative (Instead of the one-sided alternative used in Exercise 9.46) and had done a test with a significance level of 0.05, would you have rejected a
Ten people went on a Atkins diet for a month. The weight losses experienced (in pounds) were3, 8, 10, 0, 4, 6, 6, 4, 2, and -2The negative weight loss is a weight gain. Test the hypothesis that the mean weight loss was more than 0, using a significance level of 0.05. Assume the population
A biologist is interested in studying the effects that applying insecticide to a fruit farm has on the local bat population. She collects 23 bats from a grove of fruit trees where the insecticide is used and finds the mean weight of this sample to be 150.4 grams. Assuming the selected bats are a
The following numbers are the differences in pulse rate (beats per minute) before and after running for 12 randomly selected people. 24, 12, 14, 12, 16, 10, 0, 4, 13, 42, 4, and 16 Positive numbers mean the pulse rate went up. Test the hypothesis that the mean difference in pulse rate was more than
Minitab output is shown for a two-sample t-interval for the number of televisions owned in households of random samples of students at two different community colleges. Each individual was randomly chosen independently of the others. One of the schools is in a wealthy community (MC), and the other
Using data from NHANES, we looked at the pulse rate for nearly 800 people to see whether it is plausible that men and women have the same population mean. NHANES data are random and independent. Minitab output follows.a. Are the conditions for using a confidence interval for the difference between
The table shows the Minitab output for a two-sample t-test for the number of televisions owned in households of random samples of students at two different community colleges. Each individual was randomly chosen independently of the others; the students were not chosen as pairs or in groups. One of
Using data from NHANES, we looked at pulse rates of nearly 800 people to see whether men or women tended to have higher pulse rates. Refer to the Minitab output provided.a. Report the sample means, and state which group had the higher sample mean pulse rate.b. Use the Minitab output to test the
Showing 20600 - 20700
of 88243
First
200
201
202
203
204
205
206
207
208
209
210
211
212
213
214
Last
Step by Step Answers
.png)
.png)
.png)
.png)
.png)
.png)
.png)
.png)
.png)
.png)
.png)
.png)
.png)
.png)
.png)
.png)
.png)
.png)
.png)
.png)
.png)
.png)
.png)

