New Semester
Started
Get
50% OFF
Study Help!
--h --m --s
Claim Now
Question Answers
Textbooks
Find textbooks, questions and answers
Oops, something went wrong!
Change your search query and then try again
S
Books
FREE
Study Help
Expert Questions
Accounting
General Management
Mathematics
Finance
Organizational Behaviour
Law
Physics
Operating System
Management Leadership
Sociology
Programming
Marketing
Database
Computer Network
Economics
Textbooks Solutions
Accounting
Managerial Accounting
Management Leadership
Cost Accounting
Statistics
Business Law
Corporate Finance
Finance
Economics
Auditing
Tutors
Online Tutors
Find a Tutor
Hire a Tutor
Become a Tutor
AI Tutor
AI Study Planner
NEW
Sell Books
Search
Search
Sign In
Register
study help
mathematics
statistics
Applied Statistics In Business And Economics 4th Edition David Doane, Lori Seward - Solutions
Samples are shown of volatility (coefficient of variation) for sector stocks over a certain period of time.(a) At α = .05, is there a difference in median volatility in these four portfolios? Use MegaStat, MINITAB, or a similar computer package for the calculations.(b) Use one-factor ANOVA to
Define (a) Productivity, (b) Quality control, and (c) Process control.
(a) What determines sampling frequency? (b) Why are variable samples often small? (c) Why are attribute samples often large?
(a) To construct control limits for an x-bar chart, name three ways to estimate empirically.(b) Why is the R–bar method often used? (c) Why is the s method the default in MINITAB?
For an x-bar chart, what percent of sample means should be (a) Within 1 sigma of the center- line; (b) Within 2 sigmas of the centerline; (c) Within 3 sigmas of the centerline;
List four rules for detecting abnormal (special cause) observations in a control chart.
Set up control limits for an x-bar chart, given x-bar = 12.50, R–bar = .42, and n = 5.
Explain the relationship between productivity and quality from a modern perspective. How does this differ from the past perspective?
Set up control limits for an x-bar chart, given μ = 400, σ = 2, and n = 4.
Time (in seconds) to serve an early-morning customer at a fast-food restaurant is normally distributed. Set up a control chart for the mean serving time, assuming that serving times were sampled in random subgroups of 4 customers.
To print 8.5 × 5.5 note pads, a copy shop uses standard 8.5 × 11 paper, glues the long edge, then cuts the pads in half so that the pad width is 5.5 inches. However, there is variation in the cutting process. Set up a control chart for the mean width of a note pad, assuming that, in the
Set up limits for the R–bar chart, given R–bar = 0.82 and n = 6.
Set up limits for the R–bar chart, given R–bar = 12 and n = 3.
Create control limits for a p chart for a process with π = .02 and subgroup size n = 500. Is it safe to assume normality? Explain.
Create control limits for a p chart for a process with π = .50 and subgroup size n = 20. Is it safe to assume normality? Explain.
Create control limits for a p chart for a process with π = .90 and subgroup size n = .40. Is it safe to assume normality? Explain.
Find the Cp and Cpk indexes for a process with μ = 720, σ = 1.0, LSL = 715, USL = 725. How would you rate the capability of this process? Explain.
Find the Cp and Cpk indexes for a process with μ = 0.426, σ = 0.001, LSL = 0.423, USL = 0.432. How would you rate the capability of this process? Explain.
Find the Cp and Cpk indexes for a process with μ = 55.4, σ = 0.1, LSL = 55.2, USL = 55.9. How would you rate the capability of this process? Explain.
Explain each chart's purpose and the parameters that must be known or estimated to establish its control limits.a. x-bar chartb. R–bar chartc. p chartd. I chart
De ne three possible quality metrics (not necessarily the ones actually used) to describe and monitor: (a) Your performance in your college classes; (b) Effectiveness of the professors in your college classes; (c) Your effectiveness in managing your personal finances; (d) Your text- book's
De ne three quality metrics that might be used to describe quality and performance for the following services: (a) Your cellular phone service (e.g., Verizon); (b) Your Internet service provider (e.g., AOL); (c) Your dry cleaning and laundry service; (d) Your physician's of ce; (e) Your
Define three quality metrics that might be used to describe quality and performance in the following consumer products:(a) Your personal vehicle (e.g., car, SUV, truck, bicycle, motorcycle);(b) The printer on your computer;(c) The toilet in your bathroom;(d) A PDA (e.g., Palm Pilot);(e) An HDTV
Based on the cost of sampling and the presumed accuracy required, would sampling or 100 percent inspection be used to collect data on (a) The horsepower of each engine being in- stalled in new cars; (b) The fuel consumption per seat mile of each Northwest Airlines fight; (c) The daily percent of
Bob said, "We use the normal distribution to set the control limits for the x chart because samples from processes follow a normal distribution." Is Bob right? Explain.
Bob said, "They must not be using quality control in automobile manufacturing. Just look at the J.D. Power data showing that new cars all seem to have defects." (a) Discuss Bob's assertion, focusing on the concept of variation. (b) Can you think of processes where zero defects could be attained
A process has specification limits of LSL 5 540 and USL 5 550. The process standard deviation is 5 1.25. Find the Cp and Cpk capability indexes if (a) The process mean is 545; (b) The process mean is 543.
In painting an automobile, the thickness of the color coat has a lower specification limit of 0.80 mil and an upper specification limit of 1.20 mils. Find the Cp and Cpk capability indexes if (a) The process mean is 1.00 mil and the process standard deviation is 0.05 mil; and (b) The process mean
Moisture content per gram of a certain baked product has specification limits of 120 mg and 160 mg. Find the Cp and Cpk capability indexes if (a) The process mean is 140 mg and the process standard deviation is 5 mg; and (b) The process mean is 140 mg and the process standard deviation is 3 mg.
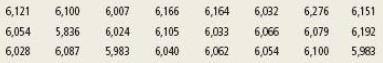
The yield strength of a metal bolt has a mean of 6,050 pounds with a standard deviation of 100 pounds. Twenty samples of three bolts were tested, resulting in the means shown below.(a) Construct upper and lower control limits for the x-bar chart, using the given product parameters.(b) Plot the data
Refer to the bolt strength problem 17.47. Assume μ = σ 6,050 and 5 100. Use the following 24 individual bolt strength observations to answer the questions posed.(a) Prepare a histogram and/or normal probability plot for the sample.(b) Does the sample support the view that yield strength is a
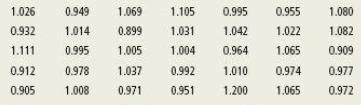
In painting an automobile at the factory, the thickness of the color coat has a process mean of 1.00 mil and a process standard deviation of 0.07 mil. Twenty samples of five cars were tested, resulting in the mean paint thicknesses shown below.(a) Construct upper and lower - control limits for the
Refer to the paint thickness problem 17.49. Assume μ = σ 1.00 and 5 0.07. Use the following 35 individual observations on paint thickness to answer the questions posed.(a) Prepare a histogram and/or normal probability plot for the sample.(b) Does the sample support the view that paint
The temperature control unit on a commercial freezer in a 24-hour grocery store is set to maintain a mean temperature of 23 degrees Fahrenheit. The temperature varies because people are constantly opening the freezer door to remove items, but the thermostat is capable of maintaining temperature
Refer to the freezer problem 17.51 with μ = 23 and σ = 2. Temperature measurements are recorded four times a day (at midnight, 0600, 1200, and 1800). Twenty samples of four - observations are shown below.(a) Construct upper and lower control limits for the x chart, using the given process
Refer to the freezer data's 80 individual temperature observations in problem 17.52. (a) Pre- pare a histogram and/or normal probability plot for the sample. (b) Does the sample support the view that freezer temperature is a normally distributed random variable? (c) Are the sample mean and standard
A Nabisco Fig Newton has a process mean weight of 14.00 g with a standard deviation of 0.10 g. The lower specification limit is 13.40 g and the upper specification limit is 14.60 g. (a) Describe the capability of this process, using the techniques you have learned. (b) Would you think that further
A new type of smoke detector battery is developed. From laboratory tests under standard conditions, the half-life (defined as less than 50 percent of full charge) of 20 batteries are shown below.(a) Make a histogram of the data and/or a probability plot. Do you think that battery half-life can be
A box of Wheat Chex cereal is to be filled to a mean weight of 466 grams. The lower specification limit is 453 grams (the labeled weight is 453 grams) and the upper specification limit is 477 grams (so as not to over fill the box). The process standard deviation is 2 grams. (a) Find the Cp and Cpk
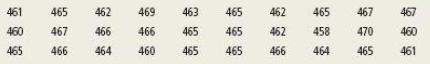
Refer to the Wheat Chex problem 17.56 with μ = 465 and σ = 3. During production, samples of three boxes are weighed every 5 minutes.(a) Find the upper and lower control limit for the x chart.(b) Plot the following 20 sample means on the chart. Is the process in control?
Refer to the Wheat Chex box fill problem 17.56 with μ = 465 and σ = 3. Below are 30 individual observations on box ll.(a) Prepare a histogram and/or normal probability plot for the sample. Does the sample support the view that box fill is a normally distributed random variable? Explain.(b) Is
Each gum drop in two bags of Sathers Gum Drops was weighed (to the nearest .001 g) on a sensitive Mettler PE 360 Delta Range scale. After removing one outlier (to improve normality), there were 84 gum drops in the sample, yielding an overall mean x-bar = 11.988 g and a pooled standard deviation s
Past experience indicates that the probability of a post-surgical complication in a certain procedure is 6 percent. A hospital typically performs 200 such surgeries per month. (a) Find the control limits for the monthly p chart. (b) Would it be reasonably safe to assume that the sample proportion
A large retail toy store finds that, on average, a certain cheap (under $20) electronic toy has a 5 percent damage rate during shipping. From each incoming shipment, a sample of 100 is inspected.(a) Find the control limits for a p chart.(b) Plot the 10 samples below on the p chart. Is the process
Which abnormal pattern (cycle, instability, level shift, oscillation, trend, mixture), if any, - exists in each of the x charts shown above? If you see none, say so. If you see more than one possibility, say so. Explain your reasoning.
Referring to Charts AF, which Rules (1, 2, 3, 4) are violated in each chart? Make a photo- copy and circle the points that violate each rule.
Refer to the bolt strength problem 17.47. Assuming μ = 6,050 and σ = 100 with n = 3, then LCL 5 5,876.8 and UCL 5 6,223.2. Below are five sets of 20 sample means using n = 3. Test each set of means for the pattern suggested in the column heading. This is a visual judgment question, though you
Refer to the paint problem 17.49 with 51.00 and μ = .07. With n = 5, LCL = .906 and UCL = 1.094. Below are five sets of 20 sample means using n = 5. Test each set of means for the pattern suggested in the column heading. This is a visual judgment question, though you Paint-P can apply Rules 14
Look up two of Deming's 14 points on the Internet and explain their meaning.’
Define a measurable aspect of quality for (a) The car dealership where you bought your car, (b) The bank or credit union where you usually make personal transactions, and (c) The movie theater where you usually go.
Which type of statistic (descriptive, inferential) is each of the following? a. Estimating the default rate on all U.S. mortgages from a random sample of 500 loans. b. Reporting the percent of students in your statistics class who use Verizon. c. Using a sample of 50 iPhones to predict the average
Which statement is false? Explain. a. Sampling error can be reduced by using appropriate data coding. b. Selection bias means that respondents are not typical of the target population. c. Simple random sampling requires a list of the population.
The management of a theme park obtained a random sample of the ages of 36 riders of its Space Adventure Simulator.(a) Make a nice histogram.(b) Did your histogram follow Sturges' Rule? If not, why not?(c) Describe the distribution of sample data.(d) Make a dot plot of the data.(e) What can be
Which one of the following is true? Why not the others? a. Histograms are useful for visualizing correlations. b. Pyramid charts are generally preferred to bar charts. c. A correlation coefficient can be negative.
Which data would be most suitable for a pie chart? Why not the others? a. Presidential vote in the last election by party (Democratic, Republican, Other). b. Retail prices of six major brands of color laser printers. c. Labor cost per vehicle for 10 major world automakers.
Here are the ages of a random sample of 20 CEOs (chief executive officers) of Fortune 500 U.S. corporations.(a) Find the mean, median, and mode.(b) Discuss advantages and disadvantages of each of these measures of center for this data set.(c) Find the quartiles and interpret them.(d) Sketch a box
A consulting firm used a random sample of 12 CIOs (chief information officers) of large businesses to examine the relationship (if any) between salary (in thousands) and years of service in the firm.(a) Make a scatter plot and describe it.(b) Calculate a correlation coefficient and interpret it.
Which statement is true? Why not the others? a. We expect the median to exceed the mean in positively skewed data. b. The geometric mean is not possible when there are negative data values. c. The midrange is resistant to outliers.
Which statement is false? Explain. a. If μ = 52 and σ = 15, then X = 81 would be an outlier. b. If the data are from a normal population, about 68 percent of the values will be within c. If μ = 640 and σ = 128 then the coefficient of variation is 20 percent.
Which is not a characteristic of using a log scale to display time series data? Explain. a. A log scale helps if we are comparing changes in two time series of dissimilar magnitude. b. General business audiences find it easier to interpret a log scale. c. If you display data on a log scale, equal
Which is not an ethical obligation of a statistician? Explain. a. To know and follow accepted procedures. b. To ensure data integrity and accurate calculations. c. To support client wishes in drawing conclusions from the data.
"Driving without a seat belt is not risky. I've done it for 25 years without an accident." This best illustrates which fallacy?a. Unconscious bias.b. Conclusion from a small sample.c. Post hoc reasoning.
Which data type (categorical, numerical) is each of the following? a. Your current credit card balance. b. Your college major. c. Your car's odometer mileage reading today.
Give the type of measurement (nominal, ordinal, interval, ratio) for each variable. a. Length of time required for a randomly chosen vehicle to cross a toll bridge. b. Student's ranking of five cell phone service providers. c. The type of charge card used by a customer (Visa, MasterCard, AmEx,
Tell if each variable is continuous or discrete. a. Tonnage carried by an oil tanker at sea. b. Wind velocity at 7 o'clock this morning. c. Number of text messages you received yesterday.
To choose a sample of 12 students from a statistics class of 36 students, which type of sample (simple random, systematic, cluster, convenience) is each of these? a. Picking every student who was wearing blue that day. b. Using Excel's = RANDBETWEEN (1,36) to choose students from the class list. c.
Which of the following is not a reason for sampling? Explain. a. The destructive nature of some tests. b. High cost of studying the entire population. c. The expense of obtaining random numbers.
Which statement is correct? Why not the others? a. Likert scales are interval if scale distances are meaningful. b. Cross-sectional data are measured over time. c. A census is always preferable to a sample.
Which statement is correct concerning one-factor ANOVA? Why not the others? a. The ANOVA is a test to see whether the variances of c groups are the same. b. In ANOVA, the k groups are compared two at a time, not simultaneously. c. ANOVA depends on the assumption of normality of the populations
Tell if each statement is true or false for a simple regression. If false, explain. a. If the standard error is syx = 3,207, then a residual ei = 4,327 would be an outlier. b. In a regression with n = 50, then a leverage statistic hi = .10 indicates unusual leverage. c. A decimal change is often
For a multiple regression, which statement is true? Why not the others? a. Evans' Rule suggests at least 10 observations for each predictor. b. The t calc in a test for significance of a binary predictor can have only two values. c. Occam's Razor says we must prefer simple regression because it is
For a multiple regression, which statement is false ? Explain. a. If R2 = .752 and R2adj = .578, the model probably has at least one weak predictor. b. R2adj can exceed R2 if the model contains some very strong predictors. c. Deleting a predictor could increase the R2adj but will not increase R2.
In this regression with n = 40, which predictor differs significantly from zero at α = .01?a. X2b. X3c. X5
Which statement is incorrect? Explain. a. We need a Tukey test because ANOVA doesn't tell which group means differ. b. Hartley's test is needed to determine whether the means of the groups differ. c. ANOVA assumes equal variances in the k groups being compared.
Given the following ANOVA table, find the F statistic and the critical value of F.05.
Given the following ANOVA:(a) How many ATM locations were there?(b) What was the sample size?(c) At α = .05, is there a significant effect due to Day of Week?(d) At α = .05, is there a significant interaction?
Given a sample correlation coefficient r = .373 with n = 30, can you reject the hypothesis ρ = 0 for the population at α = .01? Explain, stating the critical value you are using in the test.
Which statement is incorrect? Explain. a. Correlation uses a t-test with n – 2 degrees of freedom. b. Correlation analysis assumes that X is independent and Y is dependent. c. Correlation analysis is a test for the degree of linearity between X and Y.
Based on the information in this ANOVA table, the coefficient of determination R2 isa. 0.499b. 0.501c. 0.382
In a test of the regression model Y = β0 + β1 with 27 observations, what is the critical value of t to test the hypothesis β1 = 0 using α = .05 in a two-tailed test? a. 1.960 b. 2.060 c. 1.708
Which statement is correct for a simple regression? Why not the others?a. A 95% confidence interval (CI) for the mean of Y is wider than the 95% CI for the predicted Y.b. A confidence interval for the predicted Y is widest when X = x-bar.c. The t test for zero slope always gives the same tcalc as
Which type of probability (empirical, classical, subjective) is each of the following? a. On a given Friday, the probability that Flight 277 to Chicago is on time is 23.7%. b. Your chance of going to Disney World next year is 10%. c. The chance of rolling a 3 on two dice is 1y8.
Which probability distribution (uniform, binomial, Poisson) is most nearly appropriate to de- scribe each situation (assuming you knew the relevant parameters)? a. The number of dimes older than 10 years in a random sample of 8 dimes. b. The number of hospital patients admitted during a given
Which statement is false? Explain. a. In the hypergeometric distribution, sampling is done without replacement. b. The mean of the uniform distribution is always (a + b) / 2. c. We use the geometric distribution to find probabilities of arrivals per unit of time.
Which statement is false? Explain.a. To find probabilities in a continuous distribution, we add up the probabilities at each point.b. A uniform continuous model U(5,21) has mean 13 and standard deviation 4.619.c. A uniform PDF is constant for all values within the interval a ≤ X ≤ b.
Which statement is true for a normal distribution? Why not the others? a. The shape of the PDF is always symmetric regardless of and. b. The shape of the CDF resembles a bell-shaped curve. c. When no tables are available, areas may be found by a simple formula.
If freeway speeds are normally distributed with a mean of μ = 70 mph and σ = 7 mph, find the probability that the speed of a randomly chosen vehicle(a) Exceeds 78 mph;(b) Is between 65 and 75 mph;(c) Is less than 70 mph.
In the previous problem, calculate(a) The 95th percentile of vehicle speeds (i.e., 95 percent below);(b) The lowest 10 percent of speeds;(c) The highest 25 percent of speeds (3rd quartile).
If arrivals follow a Poisson distribution with mean 1.2 arrivals per minute, find the probability that the waiting time until the next arrival will be (a) Less than 1.5 minutes; (b) More than 30 seconds; (c) Between 1 and 2 minutes.
In the previous problem, find (a) The 95th percentile of waiting times (i.e., 95 percent below); (b) The first quartile of waiting times; (c) The mean time between arrivals.
Which statement is correct concerning the normal approximation? Why not the others? a. The normal Poisson approximation is acceptable when λ ≥ 10. b. The normal binomial approximation is better when n is small and π is large. c. Normal approximations are needed since Excel lacks discrete
For the following contingency table, find(a) P(H ˆ© T):(b) P (S | G):(c) P (S)
Which statement is incorrect? Explain. a. The triangular always has a single mode. b. The mean of the triangular is (a + b + c)/3. c. The triangular cannot be skewed left or right.
If P(A) = .30, P(B) = .70, and P(A ∩ B) = .25, are A and B independent events? Explain.
Which statement is false? Explain.a. If P(A) = .05, then the odds against event A's occurrence are 19 to 1.b. If A and B are mutually exclusive events, then P(A ∪ B) = 0.c. The number of permutations of 5 things taken 2 at a time is 20.
Which statement is true? Why not the others? a. The Poisson distribution has two parameters. b. The binomial distribution assumes dependent random trials. c. The uniform distribution has two parameters.
If the payoff of a risky investment has three possible outcomes ($1,000, $2,000, $5,000) with probabilities .60, .30, and .10 respectively, find the expected value. a. $1,500 b. $2,300 c. $1,700
Assuming independent arrivals with a mean of 2.5 arrivals per minute, nd the probability that in a given minute there will be(a) Exactly 2 arrivals;(b) At least 3 arrivals;(c) Fewer than 4 arrivals.(d) Which probability distribution did you use and why?
If a random experiment whose success probability is .20 is repeated 8 times, nd the probability of(a) Exactly 3 successes;(b) More than 3 successes;(c) At most 2 successes.(d) Which probability distribution did you use and why?
In a random experiment with 50 independent trials with constant probability of success .30, find the mean and standard deviation of the number of successes.
Showing 26500 - 26600
of 88243
First
259
260
261
262
263
264
265
266
267
268
269
270
271
272
273
Last
Step by Step Answers
.png)
.png)

.png)
.png)
.png)
.png)
.png)
.png)

.png)
.png)
.png)
.png)
.png)

