New Semester
Started
Get
50% OFF
Study Help!
--h --m --s
Claim Now
Question Answers
Textbooks
Find textbooks, questions and answers
Oops, something went wrong!
Change your search query and then try again
S
Books
FREE
Study Help
Expert Questions
Accounting
General Management
Mathematics
Finance
Organizational Behaviour
Law
Physics
Operating System
Management Leadership
Sociology
Programming
Marketing
Database
Computer Network
Economics
Textbooks Solutions
Accounting
Managerial Accounting
Management Leadership
Cost Accounting
Statistics
Business Law
Corporate Finance
Finance
Economics
Auditing
Tutors
Online Tutors
Find a Tutor
Hire a Tutor
Become a Tutor
AI Tutor
AI Study Planner
NEW
Sell Books
Search
Search
Sign In
Register
study help
mathematics
statistics
Introductory Statistics 8th Edition Prem S. Mann - Solutions
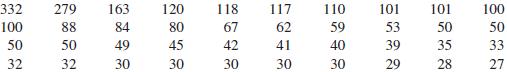
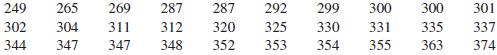
Refer to Exercise 2.21, which contains data on the amount of money donated to charity by the top 40 donors in the 2010 Slate 60. Here are the amounts rounded to the nearest million dollars.a. Prepare a stem-and-leaf display for the data. The stems should consist of the hundreds digits, and the
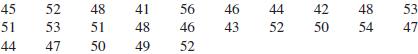
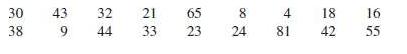
These data give the times (in minutes) taken to commute from home to work for 20 workers.Construct a stem-and-leaf display for these data. Arrange the leaves for each stem in increasing order.
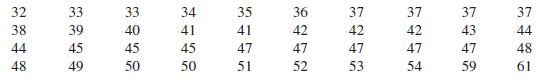
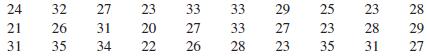
The following data give the times served (in months) by 35 prison inmates who were released recently.a. Prepare a stem-and-leaf display for these data.b. Condense the stem-and-leaf display by grouping the stems as 0€“2, 3€“5, and 6€“9.
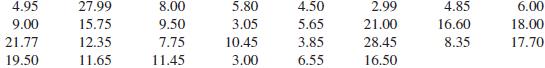
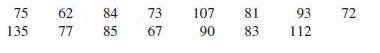
The following data give the money (in dollars) spent on textbooks by 35 students during the 2011€“12 academic year.a. Prepare a stem-and-leaf display for these data using the last two digits as leaves.b. Condense the stem-and-leaf display by grouping the stems as 2€“4, 5€“6, and
Briefly explain how to prepare a dotplot for a data set. You may use an example to illustrate.
What is a stacked dotplot, and how is it used? Explain.
Create a dotplot for the following data set.
Refer to data given in Exercise 2.20 on the number of fatal motorcycle accidents in each of South Carolina€™s 46 counties during the year 2009. Create a dotplot for those data.
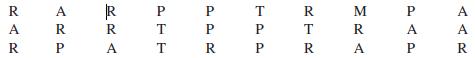
Thirty adults were asked which of the following conveniences they would find most difficult to do without: television (T), refrigerator (R), air conditioning (A), public transportation (P), or microwave (M). Their responses are listed below.a. Prepare a frequency distribution table.b. Calculate the
Refer to data given in Exercise 2.28 on the number of turnovers (fumbles and interceptions) that occurred in each of North Carolina State University€™s football games during the 2009 and 2010 seasons. Create a dotplot for those data.
Refer to data given in Exercise 2.29 on the number of hot dogs consumed by 24 patrons at a baseball game. Create a dotplot for those data.
The following data give the number of times each of the 30 randomly selected account holders at a bank used that bank€™s ATM during a 60-day period.Create a dotplot for these data and point out any clusters or outliers.
The following data give the number of times each of the 20 randomly selected male students from a state university ate at fast-food restaurants during a 7-day period.Create a dotplot for these data and point out any clusters or outliers.
Reconsider Exercise 2.63. The following data give the number of times each of the 20 randomly selected female students from the same state university ate at fast-food restaurants during the same 7-day period.a. Create a dotplot for these data.b. Use the dotplots for male and female students to
In basketball, a double-double occurs when a player accumulates double-digit numbers in any two of five statistical categories€”points, rebounds, assists, steals, and blocked shots€”in one game. The following table gives the number of times each player of the Miami Heat
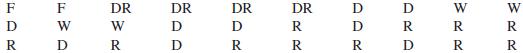
The following data give the political party of each of the first 30 U.S. presidents. In the data, D stands for Democrat, DR for Democratic Republican, F for Federalist, R for Republican, and W for Whig.a. Prepare a frequency distribution table for these data.b. Calculate the relative frequency and
In an April 18, 2010 Pew Research Center report entitled Distrust, Discontent, Anger and Partisan Rancor€”The People and Their Government, 2505 U.S. adults were asked, €œWhich is the bigger problem with the Federal government?€ Of the respondents, 38% said that Federal government has the
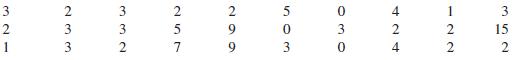
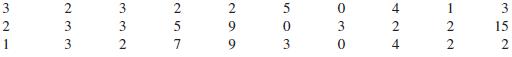
The following data give the numbers of television sets owned by 40 randomly selected households.a. Prepare a frequency distribution table for these data using single-valued classes.b. Compute the relative frequency and percentage distributions.c. Draw a bar graph for the frequency distribution.d.
Twenty-four students from universities in Connecticut were asked to name the five current members of the U.S. House of Representatives from Connecticut. The numbers of correct names supplied by the students are given below.a. Prepare a frequency distribution for these data using single-valued
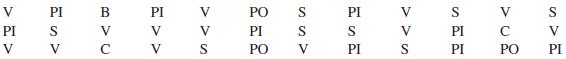
A whatjapanthinks.com survey asked residents of Japan to name their favorite pizza topping. The possible responses included the following choices: pig-based meats, for example, bacon or ham (PI); seafood, for example, tuna, crab, or cod roe (S); vegetables and fruits (V); poultry (PO); beef (B);
The following data give the number of text messages sent on 40 randomly selected days during 2012 by a high school student:a. Construct a frequency distribution table. Take 32 as the lower limit of the first class and 6 as the class width.b. Calculate the relative frequency and percentage for each
The following data give the numbers of orders received for a sample of 30 hours at the Timesaver Mail Order Company.a. Construct a frequency distribution table. Take 23 as the lower limit of the first class and 7 as the width of each class.b. Calculate the relative frequencies and percentages for
The following data give the amounts (in dollars) spent on refreshments by 30 spectators randomly selected from those who patronized the concession stands at a recent Major League Baseball game.a. Construct a frequency distribution table using the less-than method to write classes. Take $0 as the
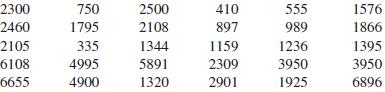
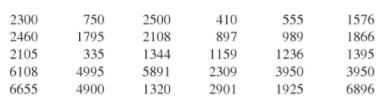
The following data give the repair costs (in dollars) for 30 cars randomly selected from a list of cars that were involved in collisions.a. Construct a frequency distribution table. Take $1 as the lower limit of the first class and $1400 as the width of each class.b. Compute the relative
Refer to Exercise 2.70. Prepare the cumulative frequency, cumulative relative frequency, and cumulative percentage distributions by using the frequency distribution table of that exercise.a. Construct a frequency distribution table. Take 32 as the lower limit of the first class and 6 as the class
Refer to Exercise 2.71. Prepare the cumulative frequency, cumulative relative frequency, and cumulative percentage distributions using the frequency distribution table constructed for the data of that exercise.
Refer to Exercise 2.72. Prepare the cumulative frequency, cumulative relative frequency, and cumulative percentage distributions using the frequency distribution table constructed for the data of that exercise.
Construct the cumulative frequency, cumulative relative frequency, and cumulative percentage distributions by using the frequency distribution table constructed for the data of Exercise 2.73.
Refer to Exercise 2.70. Prepare a stem-and-leaf display for the data of that exercise.
Construct a stem-and-leaf display for the data given in Exercise 2.71.
The following data show the method of payment by 16 customers in a supermarket checkout line. Here, C refers to cash, CK to check, CC to credit card, and D to debit card, and O stands for other.a. Construct a frequency distribution table.b. Calculate the relative frequencies and percentages for all
The following table gives the seven most common first names among girls born in the United States during 2010 along with their frequencies (in thousands). Name Number of girls (in thousands) Isabella............. 22.7 Sophia.............. 20.5 Emma.............
The following table lists the average price (as defined by the U.S. Energy Information Administration) per gallon of unleaded regular gasoline in each of the seven regions of the United States. These averages were calculated from the weekly averages for the period June 14, 2010 through June 6,
The following data give the waiting times (in minutes) for 25 students at the Student Health Center of a university.Create a dotplot for these data.
Reconsider the data on the numbers of orders received for a sample of 30 hours at the Timesaver Mail Order Company given in Exercise 2.71. Create a dotplot for those data.
Refer to Exercise 2.70, which contains data on the number of text messages sent by a high school student on each of 40 randomly selected days. Create a dotplot for those data.
The following data give the number of visitors during visiting hours on a given evening for each of the 20 randomly selected patients at a hospital.Create a dotplot for these data.
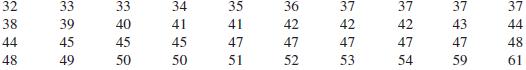
The following frequency distribution table gives the age distribution of drivers who were at fault in auto accidents that occurred during a 1-week period in a city.Age (years) f18 to less than 20....... 720 to less than 25....... 1225 to less than 30....... 1830 to less than 40.......
Refer to the data presented in Exercise 2.86. There were 50% more accidents in the 25 to less than 30 age group than in the 20 to less than 25 age group. Does this suggest that the older group of drivers in this city is more accident-prone than the younger group? What other explanation might
Suppose a data set contains the ages of 135 autoworkers ranging from 20 to 53 years.a. Using Sturge’s formula given in footnote 1 in section 2.2.2, find an appropriate number of classes for a frequency distribution for this data set.b. Find an appropriate class width based on the number of
Stem-and-leaf displays can be used to compare distributions for two groups using a back-to-back stem-and-leaf display. In such a display, one group is shown on the left side of the stems, and the other group is shown on the right side. When the leaves are ordered, the leaves increase as one moves
In a May 4, 2011 Quinnipiac University poll, a random sample of New York City residents were asked, “How serious is the problem of police officers fixing tickets: very serious, somewhat serious, not too serious, or not at all serious?” (Note: In 2010 to 2011, New York City investigated the
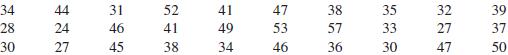
Statisticians often need to know the shape of a population to make inferences. Suppose that you are asked to specify the shape of the population of weights of all college students.a. The following data give the weights (in pounds) of a random sample of 44 college students (F and M indicate female
Consider the two histograms given in Figure 2.25, which are drawn for the same data set. In this data set, none of the values are integers.a. What are the endpoints and widths of classes in each of the two histograms?b. In the first histogram, of the observations that fall in the interval that is
Refer to the data on weights of 44 college students given in Exercise 2.90. Create a dotplot of all 44 weights. Then create stacked dotplots for the weights of male and female students. Describe the similarities and differences in the distributions of weights of male and female students. Using all
The pie chart in Figure 2.26 shows the percentage distribution of ages (i.e., the percentages of all prostate cancer patients falling in various age groups) for men who were recently diagnosed with prostate cancer. a. Are more or fewer than 50% of these patients in their 50s? How can you tell? b.
As shown in Exercise 2.89, back-to-back stem-and-leaf displays can be used to compare the distribution of a variable for two different groups. Consider the following data, which give the alcoholContent by volume (%) for different beers produced by the Flying Dog Brewery and the Sierra Nevada
The following table lists the earnings per event that were referred to in Exercise 2.89. Although the table lists earnings per event, players are listed in order of their total earnings, not their earnings per event. Men and women are ranked together in the table.A graph that is similar to an ogive
Table 2.18 shows the differences in obesity rates (called Rate Change in the table) for the years 2010 and 1997 for each of the 50 states and the District of Columbia. The obesity rate is the percentage of people having a body mass index (BMI) of 30 or higher. Figure 2.28 is a dotplot of these
Figure 2.29 contains stacked dotplots of 2010 state obesity rates for the regions Midwest, Northeast, South, and West.a. Which region has the least variability (greatest consistency) of obesity rates? Which region has the most variability (least consistency) of obesity rates? Justify your
CBS Sports had a Face book page for the 2009 NCAA Men€™s Basketball Tournament including bracket contests, discussion sites, and a variety of polls. One of the polls asked users to identify their most despised teams. The pie chart in Figure 2.30 gives a breakdown of the votes by the
Briefly explain the difference between ungrouped and grouped data and give one example of each type.
The following table gives the frequency distribution of times (to the nearest hour) that 90 fans spent waiting in line to buy tickets to a rock concert. Waiting Time (hours) Frequency 0 to 6......... 5 7 to 13........ 27 14 to 20........ 30 21 to 27........
Briefly explain and illustrate with the help of graphs a symmetric histogram, a histogram skewed to the right, and a histogram skewed to the left.
Twenty elementary school children were asked if they live with both parents (B), father only (F), mother only (M), and someone else (S). The responses of the children follow.a. Construct a frequency distribution table.b. Write the relative frequencies and percentages for all categories.c. What
A large Midwestern city has been chronically plagued by false fire alarms. The following data set gives the number of false alarms set off each week for a 24-week period in this city.a. Construct a frequency distribution table. Take 1 as the lower limit of the first class and 3 as the width of each
Refer to the frequency distribution prepared in Problem 5. Prepare the cumulative percentage distribution using that table. Draw an ogive for the cumulative percentage distribution.
Construct a stem-and-leaf display for the following data, which give the times (in minutes) that 24 customers spent waiting to speak to a customer service representative when they called about problems with their Internet service provider.
Consider this stem-and-leaf display:Write the data set that was used to construct this display.
Make a dotplot for the data given in Problem 5.
Explain how the value of the median is determined for a data set that contains an odd number of observations and for a data set that contains an even number of observations.
The following data set belongs to a sample:Calculate the mean, median, and mode.
Prepare a box-and-whisker plot for the following data:Does this data set contain any outliers?
The following data give the time (in minutes) that each of 20 students selected from a university waited in line at their bookstore to pay for their textbooks in the beginning of the Fall 2012 semester.Prepare a box-and-whisker plot. Comment on the skewness of these data.
Refer to Exercise 3.97. The following data represent the credit scores of 22 randomly selected loan applicants.Prepare a box-and-whisker plot. Are these data skewed in any direction?
The following data give the 2009 estimates of crude oil reserves (in billions of barrels) of Saudi Arabia, Iran, Iraq, Kuwait, Venezuela, the United Arab Emirates, Russia, Libya, Nigeria, Canada, the United States, China, Brazil, and Mexico (source: www.eia.gov).Prepare a box-and-whisker plot. Is
The following data give the numbers of computer keyboards assembled at the Twentieth Century Electronics Company for a sample of 25 days.Prepare a box-and-whisker plot. Comment on the skewness of these data.
Refer to Exercise 3.93. The following data represent the numbers of minor penalties accrued by each of the 30 National Hockey League franchises during the 2010€“11 regular season.Prepare a box-and-whisker plot. Are these data skewed in any direction?
Refer to Exercise 3.22. The following data represent the number of Grand Jury indictments forGloucester County, New Jersey, for a sample of 11 weeks selected from July 2010 through June 2011 as reproduced from that exercise:Make a box-and-whisker plot. Comment on the skewness of these data.
Nixon Corporation manufactures computer monitors. The following are the numbers of computer monitors produced at the company for a sample of 30 days:Prepare a box-and-whisker plot. Comment on the skewness of these data.
The following data give the numbers of new cars sold at a dealership during a 20-day period.Make a box-and-whisker plot. Comment on the skewness of these data.
Each year the faculty at Metro Business College chooses 10 members from the current graduating class that they feel are most likely to succeed. The data below give the current annual incomes (in thousands of dollars) of the 10 members of the class of 2004 who were voted most likely to succeed.a.
The following table gives the standard deductions and personal exemptions for persons filing with “single” status on their 2011 state income taxes in a random sample of 9 states. Calculate the mean and median for the data on standard deductions for these states.
The Belmont Stakes is the final race in the annual Triple Crown of thoroughbred horse racing. The race is 1.5 miles in length, and the record for the fastest time of 2 minutes, 24 seconds is held by Secretariat, the 1973 winner. We compared Secretariat€™s time from 1973 with the time of each
The following table gives the total points scored by each of the top 16 National Basketball Association (NBA) scorers during the 2010€“11 regular seasonsa. Calculate the mean and median. Do these data have a mode? Why or why not?b. Compute the range, variance, and standard deviation for these
The following data give the numbers of driving citations received during the last three years by 12 drivers.a. Find the mean, median, and mode for these data.b. Calculate the range, variance, and standard deviation.c. Are the values of the summary measures in parts a and b population parameters or
The following table gives the distribution of the amounts of rainfall (in inches) for July 2012 for 50 cities. Rainfall Number of Cities0 to less than 2.......... 62 to less than 4.......... 104 to less than 6.......... 206 to less than 8.......... 78 to less than 10..........
The following table gives the frequency distribution of the times (in minutes) that 50 commuter students at a large university spent looking for parking spaces on the first day of classes in the fall semester of 2012. Time Number of Students0 to less than 4............ 14 to less than
The mean time taken to learn the basics of a software program by all students is 200 minutes with a standard deviation of 20 minutes.a. Using Chebyshev’s theorem, find at least what percentage of students will learn the basics of this software program ini. 160 to 240 minutesii. 140 to 260
According to the American Time Use Survey conducted by the Bureau of Labor Statistics (www.bls.gov/atus/), Americans spent an average of 985.50 hours watching television in 2010. Suppose that the standard deviation of the distribution of times that Americans spent watching television in 2010 is
Refer to Exercise 3.115. Suppose the times taken to learn the basics of this software program by all students have a bell-shaped distribution with a mean of 200 minutes and a standard deviation of 20 minutes.a. Using the empirical rule, find the percentage of students who will learn the basics of
The annual earnings of all employees with CPA certification and 6 years of experience and working for large firms have a bell-shaped distribution with a mean of $134,000 and a standard deviation of $12,000.a. Using the empirical rule, find the percentage of all such employees whose annual earnings
Refer to the data of Exercise 3.109 on the current annual incomes (in thousands of dollars) of the 10 members of the class of 2004 of the Metro Business College who were voted most likely to succeed.a. Determine the values of the three quartiles and the interquartile range. Where does the value of
Refer to the data table in Exercise 3.11. Calculate the mean and median for the data on personal exemptions for these states.In Exercise 11
Refer to the data given in Exercise 3.111 on the total points scored by each of the top 16 NBA scorers during the 2010–11 regular seasons. a. Calculate the values of the three quartiles and the interquartile range. Where does the number 1681 fall in relation to these quartiles? b. Find the
A student washes her clothes at a Laundromat once a week. The data below give the time (in minutes) she spent in the Laundromat for each of 15 randomly selected weeks. Here, time spent in the Laundromat includes the time spent waiting for a machine to become available.Prepare a box-and-whisker
The following data give the lengths of time (in weeks) taken to find a full-time job by 18 computer science majors who graduated in 2011 from a small college.Make a box-and-whisker plot. Comment on the skewness of this data set. Does this data set contain any outliers?
Melissa’s grade in her math class is determined by three 100-point tests and a 200-point final exam. To determine the grade for a student in this class, the instructor will add the four scores together and divide this sum by 5 to obtain a percentage. This percentage must be at least 80 for a
Jeffrey is serving on a six-person jury for a personal-injury lawsuit. All six jurors want to award damages to the plaintiff but cannot agree on the amount of the award. The jurors have decided that each of them will suggest an amount that he or she thinks should be awarded; then they will use the
The heights of five starting players on a basketball team have a mean of 76 inches, a median of 78 inches, and a range of 11 inches. a. If the tallest of these five players is replaced by a substitute who is 2 inches taller, find the new mean, median, and range. b. If the tallest player is replaced
On a 300-mile auto trip, Lisa averaged 52 mph for the first 100 miles, 65 mph for the second 100 miles, and 58 mph for the last 100 miles. a. How long did the 300-mile trip take? b. Could you find Lisa’s average speed for the 300-mile trip by calculating (52 + 65 + 58)/3? If not, find the correct
A small country bought oil from three different sources in one week, as shown in the following table.Find the mean price per barrel for all 1300 barrels of oil purchased in that week.
During the 2011–12 winter seasons, a homeowner received four deliveries of heating oil, as shown in the following table. Gallons Purchased Price per Gallon ($) 209…………………...................
In the Olympic Games, when events require a subjective judgment of an athlete’s performance, the highest and lowest of the judges’ scores may be dropped. Consider a gymnast whose performance is judged by seven judges and the highest and the lowest of the seven scores are dropped. a. Gymnast
The following data give the 2010 gross domestic product (in billions of dollars) for all 50 states. The data are entered in alphabetical order by state (Source: Bureau of Economic Analysis).a. Calculate the mean and median for these data. Are these values of the mean and the median sample
A survey of young people’s shopping habits in a small city during the summer months of 2012 showed the following: Shoppers aged 12 to 14 years took an average of 8 shopping trips per month and spent an average of $14 per trip. Shoppers aged 15 to 17 years took an average of 11 trips per month and
The following table shows the total population and the number of deaths (in thousands) due to heart attack for two age groups (in years) in Countries A and B for 2011.a. Calculate the death rate due to heart attack per 1000 population for the 30 years and under age group for each of the two
In a study of distances traveled to a college by commuting students, data from 100 commuters yielded a mean of 8.73 miles. After the mean was calculated, data came in late from three students, with respective distances of 11.5, 7.6, and 10.0 miles. Calculate the mean distance for all 103 students.
The test scores for a large statistics class have an unknown distribution with a mean of 70 and a standard deviation of 10.a. Find k so that at least 50% of the scores are within k standard deviations of the mean.b. Find k so that at most 10% of the scores are more than k standard deviations above
The test scores for a very large statistics class have a bell-shaped distribution with a mean of 70 points.a. If 16% of all students in the class scored above 85, what is the standard deviation of the scores?b. If 95% of the scores are between 60 and 80, what is the standard deviation?
Showing 26700 - 26800
of 88243
First
261
262
263
264
265
266
267
268
269
270
271
272
273
274
275
Last
Step by Step Answers
.png)
.png)

.png)


.png)
.png)
.png)


.png)

.png)
.png)
-1.png)
-2.png)
.png)
-1.png)
-1.png)
-2.png)
-3.png)
-1.png)
-2.png)
.png)
.png)


.png)


.png)
.png)
.png)
.png)
.png)


