New Semester
Started
Get
50% OFF
Study Help!
--h --m --s
Claim Now
Question Answers
Textbooks
Find textbooks, questions and answers
Oops, something went wrong!
Change your search query and then try again
S
Books
FREE
Study Help
Expert Questions
Accounting
General Management
Mathematics
Finance
Organizational Behaviour
Law
Physics
Operating System
Management Leadership
Sociology
Programming
Marketing
Database
Computer Network
Economics
Textbooks Solutions
Accounting
Managerial Accounting
Management Leadership
Cost Accounting
Statistics
Business Law
Corporate Finance
Finance
Economics
Auditing
Tutors
Online Tutors
Find a Tutor
Hire a Tutor
Become a Tutor
AI Tutor
AI Study Planner
NEW
Sell Books
Search
Search
Sign In
Register
study help
mathematics
statistics
Applied Statistics In Business And Economics 4th Edition David Doane, Lori Seward - Solutions
Review the two residual plots below. Do either of these show evidence that the regression error assumptions of normality and constant variation have been violated? Explain.
Review the two residual plots below. Do either of these show evidence that the regression error assumptions of normality and constant variation have been violated? Explain.
An estimated regression for a random sample of observations on an assembly line is Defects = 3.2 + 0.045 Speed, where Defects is the number of defects per million parts and Speed is the number of units produced per hour. The estimated standard error is se = 1.07. Suppose that 100 units per hour are
An estimated regression for a random sample of vehicles is MPG = 49.22 – 0.081 Horse- power, where MPG is miles per gallon and Horsepower is the engine's horsepower. The standard error is se = 2.03. Suppose an engine has 200 horsepower and its actual (observed) fuel efficiency is MPG = 38.15.(a)
A sample of season performance measures for 29 NBA teams was collected for a season. A regression analysis was performed on two of the variables with Y = total number of free throws made and X = total number of free throws attempted. Calculate the leverage statistic for the following three teams
A sample of 74 Noodles & Company restaurants was used to perform a regression analysis with Y = % Annual Revenue Growth and X = % Revenue Due to Loyalty Card Use. Calculate the leverage statistic for the following three restaurants and state whether or not the leverage - would be considered
Moviegoer Snack Spending (n = 10)(a) Make a scatter plot of the data. What does it suggest about the correlation between X and Y? (b) Use Excel, MegaStat, or MINITAB to calculate the correlation coefficient.(c) Use Excel or Appendix D to find t.025 for a two-tailed test at α =.05.(d) Calculate
State your a priori hypothesis about the sign of the slope. Is it reasonable to suppose a cause- and-effect relationship?
Make a scatter plot of Y against X. Discuss what it tells you.
Use Excel, MegaStat, or MINITAB to t the regression model, including residuals and standardized residuals.
(a) Does the 95 percent confidence interval for the slope include zero? If so, what does this tell you? If not, what does it mean? (b) Do a two-tailed t test for zero slope at α = .05. State the hypotheses, degrees of freedom, and critical value for your test. (c) Interpret the p-value for the
(a) Based on the R2 and ANOVA table for your model, how would you assess the t? (b) Interpret the p-value for the F statistic. (c) Would you say that your model's t is good enough to be of practical value?
Annual Percent Return on Mutual Funds (n = 17)(a) Make a scatter plot of the data. What does it suggest about the correlation between X and Y? (b) Use Excel, MegaStat, or MINITAB to calculate the correlation coefficient.(c) Use Excel or Appendix D to find t.025 for a two-tailed test at α
Study the table of residuals. Identify as outliers any standardized residuals that exceed 3 and as unusual any that exceed 2. Can you suggest any reasons for these unusual residuals?
(a) Make a histogram (or normal probability plot) of the residuals and discuss its appearance.(b) Do you see evidence that your regression may violate the assumption of normal errors?
Inspect the residual plot to check for heteroscedasticity and report your conclusions.
Use MegaStat or MINITAB to generate 95 percent confidence and prediction intervals for various X-values.
A study of the role of spreadsheets in planning in 55 small firms de fined Y = "satisfaction with sales growth" and X = "executive commitment to planning." Analysis yielded an overall correlation of r = .3043. Do a two-tailed test for zero correlation at α = .025.
In a study of stock prices from 1970 to 1994, the correlation between Nasdaq closing prices on successive days (i.e., with a 1-day lag) was r = .13 with a t statistic of 5.47. Interpret this result.
Regression analysis of free throws by 29 NBA teams during the 20022003 season revealed the fitted regression Y = 55.2 + .73X (R2 = .874, syx = 53.2), where Y = total free throws made and X = total free throws attempted. The observed range of X was from 1,620 (New York Knicks) to 2,382 (Golden
Order Size and Shipping Cost (n = 12)(a) Make a scatter plot of the data. What does it suggest about the correlation between X and Y? (b) Use Excel, MegaStat, or MINITAB to calculate the correlation coefficient.(c) Use Excel or Appendix D to find t.025 for a two-tailed test at α =.05.(d)
In the following regression, X = weekly pay, Y = income tax withheld, and n = 35 McDonald's employees.(a) Write the fitted regression equation.(b) State the degrees of freedom for a two- tailed test for zero slope, and use Appendix D to find the critical value at α = .05.(c) What is your
In the following regression, X = monthly maintenance spending (dollars), Y = monthly machine downtime (hours), and n = 15 copy machines.(a) Write the fitted regression equation.(b) State the degrees of freedom for a two-tailed test for zero slope, and use Appendix D to find the critical value at
In the following regression, X = total assets ($ billions), Y = total revenue ($ billions), and n = 64 large banks.(a) Write the fitted regression equation.(b) State the degrees of freedom for a two-tailed test for zero slope, and use Appendix D to find the critical value at α = .05.(c) What is
Do stock prices of competing companies move together? Below are daily closing prices of two computer services firms (IBM = International Business Machines Corporation, HPQ = Hewlett-Packard Company.(a) Calculate the sample correlation coefficient (e.g., using Excel or MegaStat).(b) At α = .01
Below are percentages for annual sales growth and net sales attributed to loyalty card usage at 74 Noodles & Company restaurants.(a) Make a scatter plot.(b) Find the correlation coefficient and interpret it.(c) Test the correlation coefficient for significance, clearly stating the degrees of
Below are fertility rates (average children born per woman) in 15 EU nations for 2 years.(a) Make a scatter plot.(b) Find the correlation coefficient and interpret it.(c) Test the correlation coefficient for significance, clearly stating the degrees of freedom. (Data are from the Fertility World
Consider the following prices and accuracy ratings for 27 stereo speakers.(a) Make a scatter plot of accuracy rating as a function of price.(b) Calculate the correlation coefficient. At α = .05, does the correlation differ from zero?(c) In your own words, describe the scatter plot.
Choose one of these three data sets.(a) Make a scatter plot.(b) Let Excel estimate the regression line, with fitted equation and R2.(c) Describe the t of the regression.(d) Write the fitted regression equation and interpret the slope.(e) Do you think that the estimated intercept is meaningful?
Simple regression was employed to establish the effects of childhood exposure to lead. The effective sample size was about 122 subjects. The independent variable was the level of dentin lead (parts per million). Below are regressions using various dependent variables.(a) Calculate the t statistic
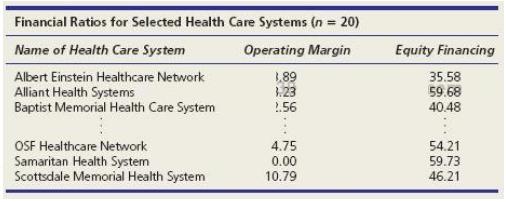
Below are recent financial ratios for a random sample of 20 integrated health care systems. Operating Margin is total revenue minus total expenses divided by total revenue plus net operating profits. Equity Financing is fund balance divided by total assets.(a) Make a scatter plot of Y = operating
(a) Interpret the slope of the fitted regression HomePrice = 125,000 + 150 SquareFeet. (b) What is the prediction for HomePrice if SquareFeet = 2,000? (c) Would the intercept be meaningful if this regression applies to home sales in a certain subdivision?
Consider the following data on 20 chemical reactions, with Y = chromatographic retention time (seconds) and X = molecular weight (gm/mole).(a) Make a scatter plot.(b) Use Excel to t the regression, with fitted equation and R2.(c) In your own words, describe the t. (Data provided by john seeley of
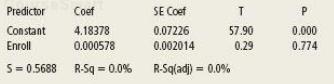
A common belief among faculty is that teaching ratings are lower in large classes. Below are MINITAB results from a regression using Y = mean student evaluation of the professor and X = class size for 364 business school classes taught during the 20022003 academic year. Ratings are on a scale of
Below are revenue and pro t (both in $ billions) for nine large entertainment companies.(a) Make a scatter plot of pro t as a function of revenue.(b) Use Excel to t the regression, with fitted equation and R2.(c) In your own words, describe the t. (Data are from Fortune 149, Entertainment no. 7
Below are fitted regressions based on used vehicle ads. Observed ranges of X are shown. The assumed regression model is Asking Price = f (VehicleAge).(a) Interpret the slopes.(b) Are the intercepts meaningful? Explain.(c) Assess the t of each model.(d) Is a bivariate model adequate to explain
Below are results of a regression of Y = average stock returns (in percent) as a function of X = average price/earnings ratios for the period 19491997 (49 years). Separate regressions were done for various holding periods (sample sizes are therefore variable).(a) Summarize what the regression
Adult height is somewhat predictable from average height of both parents. For females, a commonly used equation is YourHeight = ParentHeight – 2.5 while for males the equation is YourHeight = ParentHeight + 2.5. (a) Test these equations on yourself (or on somebody else). (b) How well did the
(a) Interpret the slope of the fitted regression Sales = 842 – 37.5 Price. (b) If Price = 20, what is the prediction for Sales? (c) Would the intercept be meaningful if this regression represents DVD sales at Blockbuster?
(a) Interpret the slope of the fitted regression CarTheft = 1,667 – 35.3 MedianAge, where CarTheft is the number of car thefts per 100,000 people by state, and MedianAge is the median age of the population. (b) What is the prediction for CarTheft if MedianAge is 40? (c) Would the intercept be
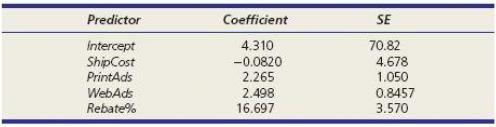
Observations are taken on net revenue from sales of a certain LCD TV at 50 retail outlets. The regression model was Y = net revenue (thousands of dollars), X1 = shipping cost (dollars per unit), X2 = expenditures on print advertising (thousands of dollars), X3 = expenditure on electronic media ads
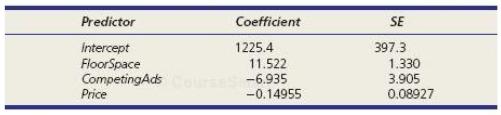
Observations are taken on sales of a certain mountain bike in 30 sporting goods stores. The regression model was Y = total sales (thousands of dollars), X1 = display floor space (square meters), X2 = competitors' advertising expenditures (thousands of dollars), X3 = advertised price (dollars per
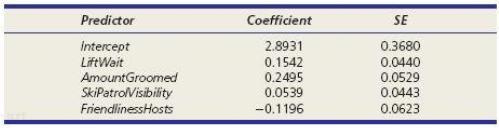
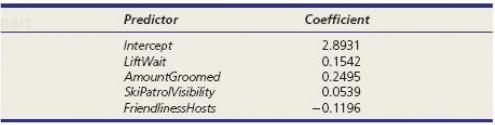
A random sample of 502 Vail Resorts' guests were asked to rate their satisfaction on various attributes of their visit on a scale of 15 with 1 = very unsatisfied and 5 = very satisfied. The regression model was Y = overall satisfaction score, X1 = lift line wait, X2 = amount of ski trail
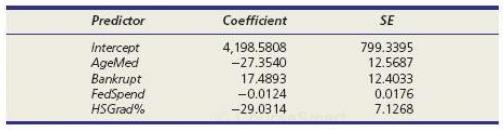
A regression model to predict Y, the state burglary rate per 100,000 people for 2005, used the following four state predictors: X1 = median age in 2005, X2 = number of 2005 bankruptcies, X3 = 2004 federal expenditures per capita (a leading predictor), and X4 = 2005 high school graduation
A regression of accountants' starting salaries in a large firm was estimated using 40 new hires and five predictors (college GPA, gender, score on CPA exam, years' prior experience, size of graduating class). The standard error was $3,620. Find the approximate width of a 95 percent prediction
An agribusiness performed a regression of wheat yield (bushels per acre) using observations on 25 test plots with four predictors (rainfall, fertilizer, soil acidity, hours of sun). The standard error was 1.17 bushels. Find the approximate width of a 95 percent prediction interval for wheat yield,
A regression model to predict the price of a condominium for a weekend getaway in a resort community included the following predictor variables: number of nights needed, number of bedrooms, whether the condominium complex had a swimming pool or not, and whether or not a parking garage was
A regression model to predict the price of diamonds included the following predictor variables: the weight of the stone (in carats where 1 carat = 0.2 gram), the color rating (D, E, F, G, H, or I), and the clarity rating (IF, VVS1, VVS2, VS1, or VS2). (a) Identify the quantitative predictor
Refrigerator prices are affected by characteristics such as whether or not the refrigerator is on sale, whether or not it is listed as a Sub-Zero brand, the number of doors (one door or two doors), and the placement of the freezer compartment (top, side, or bottom). The table below shows the
A model was developed to predict the length of a sentence (the response variable) for a male convicted of assault using the following predictor variables: age (in years), number of prior felony convictions, whether the criminal was married or not (1 = married), and whether the criminal was employed
The data set below shows a sample of salaries for 39 engineers employed by the Solnar Company along with each engineer's years of experience.(a) Construct a scatter plot using Salary as the response variable and Years as the explanatory variable. Describe the shape of the scatter plot. Does it
Observations are taken on sales of a certain mountain bike in 30 sporting goods stores. The regression model was Y = total sales (thousands of dollars), X1 = display floor space (square meters), X2 = competitors' advertising expenditures (thousands of dollars), X3 = advertised price (dollars per
The same data set from exercise 13.19 also has gender information for each engineer. The binary variable Male = 1 indicates the engineer is male and Male = 0 indicates the engineer is female. Run the regression with Salary as the response variable and Years, YearsSq, Male, and Years 3 Male as the
Using the "Vail Guest Satisfaction Survey" data, construct a correlation matrix of the 11 in- dependent variables. The response variable is ovalue. (a) Identify the four pairs of independent variables that have the highest pairwise correlation values. Do they show significant correlation? (b) Using
Using the "Metals" data, construct a correlation matrix of the six independent variables. The response variable is Priceylb. (a) Identify any pairs of independent variables that have a significant pairwise correlation. (b) Using MegaStat or MINITAB, run the regression with all six predictor
Which would be "high leverage" observations?a. Leverage hi = .15 in a regression with 5 predictors and 72 observations.b. Leverage hi = .18 in a regression with 4 predictors and 100 observations.c. Leverage hi = .08 in a regression with 7 predictors and 240 observations.
Which violations of regression assumptions, if any, do you see in these residual diagnostics? Explain.
State your a priori hypotheses about the sign (1 or 2) of each predictor and your reasoning about cause and effect. Would the intercept have meaning in this problem? Explain.
Perform the regression and write the estimated regression equation (round off to 3 or 4 significant digits for clarity). Do the coefficient signs agree with your a priori expectations?
Vail Resorts asked a random sample of guests to rate their satisfaction on various attributes of their visit on a scale of 15 with 1 = very unsatisfied and 5 = very satisfied. The estimated regression model was Y = overall satisfaction score, X1 = lift line wait, X2 = amount of ski trail
Do a two-tailed t test for zero slope for each predictor coefficient at α = .05. State the degrees of freedom and look up the critical value in Appendix D (or from Excel).
(a) Which p-values indicate predictor significance at α = .05? (b) Do the p-values support the conclusions you reached from the t tests? (c) Do you prefer the t test or the p-value approach? Why?
Based on the R2 and ANOVA table for your model, how would you describe the t?
Use the standard error to construct an approximate prediction interval for Y. Based on the width of this prediction interval, would you say the predictions are good enough to have practical value?
(a) Generate a correlation matrix for your predictors. Round the results to three decimal places.(b) Based on the correlation matrix, is collinearity a problem? What rules of thumb (if any) are you using?
(a) If you did not already do so, rerun the regression requesting variance inflation factors (VIFs) for your predictors. (b) Do the VIFs suggest that multicollinearity is a problem? Explain.
If you did not already do so, request leverage statistics. Are any observations influential? Explain.
If you did not already do so, request a histogram of standardized residuals and/or a normal probability plot. Do the residuals suggest non-normal errors? Explain.
A regression model to predict Y, the state-by-state 2005 burglary crime rate per 100,000 people, used the following four state predictors: X1 = median age in 2005, X2 = number of 2005 bankruptcies per 1,000 people, X3 = 2004 federal expenditures per capita, and X4 = 2005 high school graduation
If you did not already do so, request a plot of residuals versus the fitted Y. Is heteroscedasticity a concern?
In a model of Ford's quarterly revenue TotalRevenue = β0 + β1 CarSales + β2 TruckSales + β3 SUVSales + ε, the three predictors are measured in number of units sold (not dollars). (a) Interpret each slope. (b) Would the intercept be meaningful? (c) What factors might be reflected in the
In a study of paint peel problems, a regression was suggested to predict defects per million (the response variable). The intended predictors were supplier (four suppliers, coded as binaries) and substrate (four materials, coded as binaries). There were 11 observations. Explain why regression is
A hospital emergency room analyzed n = 17,664 hourly observations on its average occupancy rates using six binary predictors representing days of the week and two binary predictors representing the 8-hour work shift (12 a.m.8 a.m., 8 a.m.4 p.m., 4 p.m.12 a.m.) when the ER census was taken.
Using test data on 20 types of laundry detergent, an analyst fitted a regression to predict Cost- PerLoad (average cost per load in cents per load) using binary predictors TopLoad (1 if washer is a top-loading model, 0 otherwise) and Powder (if detergent was in powder form, 0 otherwise). Interpret
A researcher used stepwise regression to create regression models to predict BirthRate (births per 1,000) using five predictors: LifeExp (life expectancy in years), InfMort (infant mortality rate), Density (population density per square kilometer), GDPCap (Gross Domestic Product per capita), and
A sports enthusiast created an equation to predict Victories (the team's number of victories in the National Basketball Association regular season play) using predictors FGP (team field goal percentage), FTP (team free throw percentage), Points (team average points per game), Fouls (team average
An expert witness in a case of alleged racial discrimination in a state university school of nursing introduced a regression of the determinants of Salary of each professor for each year during an 8-year period (n = 423) with the following results, with dependent variable Salary and predictors Year
Analysis of a Detroit Marathon (n = 1,015 men, n = 150 women) produced the regression results shown below, with dependent variable Time (the marathon time in minutes) and predictors Age (runner's age), Weight (runner's weight in pounds), Height (runner's height in inches), and Exp (1 if runner had
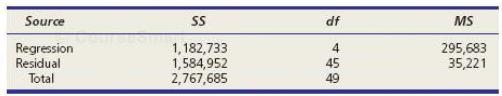
Refer to the ANOVA table below.(a) State the degrees of freedom for the F test for overall significance.(b) Use Appendix F to look up the critical value of F for α = .05.(c) Calculate the F statistic. Is the regression significant overall?(d) Calculate R2 and R2, showing your R2adj
Using test data on 43 vehicles, an analyst fitted a regression to predict CityMPG (miles per gallon in city driving) using as predictors Length (length of car in inches), Width (width of car in inches), and Weight (weight of car in pounds). Interpret the results. Do you see evidence that some
A researcher used stepwise regression to create regression models to predict CarTheft (thefts per 1,000) using four predictors: Income (per capita income), Unem (unemployment percent), Pupil/Tea (pupil-to-teacher ratio), and Divorce (divorces per 1,000 population) for the 50 U.S. states. Interpret
Refer to the ANOVA table below.(a) State the degrees of freedom for the F test for overall significance.(b) Use Appendix F to look up the critical value of F for α = .05.(c) Calculate 2 the F statistic. Is the regression significant overall?(d) Calculate R2 and Radj, showing your
Refer to the ANOVA table below.(a) State the degrees of freedom for the F test for overall significance.(b) Use Appendix F to look up the critical value of F for α = .05.(c) Calculate the F statistic. Is the regression significant overall?(d) Calculate R2 and R2adj, showing your
Refer to the ANOVA table below.(a) State the degrees of freedom for the F test for overall significance.(b) Use Appendix F to look up the critical value of F for α = .05.(c) Calculate the F statistic. Is the regression significant overall?(d) Calculate R 2 and R2adj, showing your formulas
Observations are taken on net revenue from sales of a certain LCD TV at 50 retail outlets. The regression model was Y = net revenue (thousands of dollars), X1 = shipping cost (dollars per unit), X2 = expenditures on print advertising (thousands of dollars), X3 = expenditure on electronic media ads
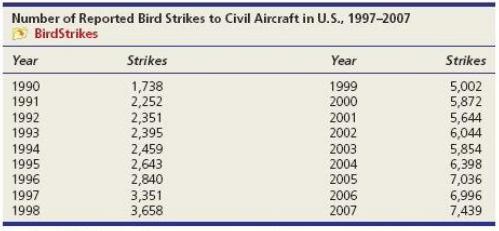
In 2009, US Airways Flight 1549 made a successful emergency landing in the Hudson River, after striking birds shortly after takeoff. Are bird strikes an increasing threat to planes?(a) Make an Excel graph of the data on bird strikes.(b) Discuss the underlying causes that might explain the trend.(c)
(a) Make a line chart for JetBlue's revenue.(b) Describe the trend (if any) and discuss possible causes.(c) Fit both a linear and an exponential trend to the data.(d) Which model is preferred? Why?(e) Make annual forecasts for 20112013, using a trend model of your JetBlue choice (or a judgment
(a) Plot both Swiss watch time series on the same graph.(b) Describe the trend (if any) and discuss possible causes.(c) Fit an exponential trend to each time series.(d) Interpret each fitted trend carefully. What conclusion do you draw?(e) Make forecasts for the next 3 years, using the linear trend
(a) Plot the total minutes of TV viewing time per household.(b) Describe the trend (if any) and discuss possible causes.(c) Fit a linear trend to the data.(d) Would this model give reason- able forecasts? Would another trend model be better? Explain.(e) Make a forecast for 2015. Show the forecast
(a) Plot the voter participation rate.(b) Describe the trend (if any) and discuss possible causes.(c) Fit both a linear and a quadratic trend to the data.(d) Which model is preferred? Why?(e) Make a forecast for 2012, using a trend model of your choice (or a judgment forecast).(f) If possible,
For each of the following tted trends, make a prediction for period t = 17:a. yt = 2286 e.076tb. yt = 1149 + 12.78tc. yt = 501 + 18.2t – 7.1t2
(a) Choose one category of consumer credit and plot it.(b) Describe the trend (if any) and discuss possible causes.(c) Fit a trend model of your choice.(d) Make forecasts for 3 years (20112013), using a trend model of your choice. Note: Revolving credit is mostly credit card and home equity
(a) Plot the data on U.S. general aviation shipments.(b) Describe the pattern and discuss possible causes.(c) Would a fitted trend be helpful? Explain.(d) Make a similar graph for 19932008 only. Would a fitted trend be helpful in making a prediction for 2009?(e) Fit a trend model of your choice
(a) Choose one beverage category and plot the data.(b) Describe the trend (if any) and discuss possible causes.(c) Would a fitted trend be helpful? Explain.(d) Fit several trend models. Which is best, and why? If none is satisfactory, explain.(e) Make forecasts for 2010 and 2015, using a trend
(a) Plot either receipts and outlays or federal debt and GDP (plot both time series on the same graph).(b) Describe the trend (if any) and discuss possible causes.(c) Fit a trend of your choice to each.(d) Interpret each fitted trend equation, explaining its implications.(e) To whom is this issue
(a) Plot both men's and women's winning times on the same graph.(b) Fit a linear trend model to each series. From the fitted trends, will the times eventually converge? Hint: Ask Excel for forecasts (e.g., 20 years ahead).(c) Make a copy of your graph, and click each fitted trend and change it to a
(a) Make an Excel graph of the data on the number of certified organic farms in the United States.(b) Discuss the underlying causes that might explain the trend or pattern.(c) Use Excel, MegaStat, or MINITAB to t three trends (linear, quadratic, exponential) to the time series.(d) Which trend model
(a) Plot the data on leisure and hospitality employment.(b) Describe the trend (if any) and discuss possible causes.(c) Fit the linear and exponential trends. Would these trend models give credible forecasts? Explain.(d) Make a forecast for 2008, using any method (including your own judgment).
(a) Plot the data on law enforcement officers killed.(b) Describe the trend (if any) and discuss possible causes or anomalies in the data.(c) Would a fitted trend be helpful? Explain.(d) Make a forecast for 2009 using any method you like (including judgment).
(a) Plot the data on lightning deaths.(b) Describe the trend (if any) and discuss possible causes.(c) Fit an exponential trend to the data. Interpret the fitted equation.(d) Make a fore- cast for 2015, using a trend model of your choice (or a judgment forecast). Explain the basis for your forecast.
Showing 26300 - 26400
of 88243
First
257
258
259
260
261
262
263
264
265
266
267
268
269
270
271
Last
Step by Step Answers
.png)
.png)
.png)
.png)
.png)
.png)
.png)
.png)
.png)
.png)
.png)
.png)
-1.png)
-2.png)
-3.png)
.png)
.png)
.png)
.png)
.png)
.png)
.png)
.png)
.png)
.png)
.png)
.png)

.png)
.png)
.png)
.png)
.png)
.png)
.png)
.png)
.png)
.png)
.png)
.png)
.png)
.png)
.png)
.png)
.png)
.png)
.png)
.png)
.png)
.png)
.png)

