New Semester
Started
Get
50% OFF
Study Help!
--h --m --s
Claim Now
Question Answers
Textbooks
Find textbooks, questions and answers
Oops, something went wrong!
Change your search query and then try again
S
Books
FREE
Study Help
Expert Questions
Accounting
General Management
Mathematics
Finance
Organizational Behaviour
Law
Physics
Operating System
Management Leadership
Sociology
Programming
Marketing
Database
Computer Network
Economics
Textbooks Solutions
Accounting
Managerial Accounting
Management Leadership
Cost Accounting
Statistics
Business Law
Corporate Finance
Finance
Economics
Auditing
Tutors
Online Tutors
Find a Tutor
Hire a Tutor
Become a Tutor
AI Tutor
AI Study Planner
NEW
Sell Books
Search
Search
Sign In
Register
study help
mathematics
statistics
Applied Statistics In Business And Economics 4th Edition David Doane, Lori Seward - Solutions
A ski company in Vail owns two ski shops, one on the west side and one on the east side of Vail. Ski hat sales data (in dollars) for a random sample of 5 Saturdays during the 2004 sea- son showed the following results. Is there a significant difference in sales dollars of hats between the west side
Emergency room arrivals in a large hospital showed the statistics below for 2 months. At α = .05, has the variance changed? Show all steps clearly, including an illustration of the decision rule.
Concerned about graffiti, mayors of nine suburban communities instituted a citizen Com- munity Watch program.(a) State the hypotheses to see whether the number of graffiti incidents declined.(b) Find the test statistic.(c) State the critical value for α = .05.(d) Find the p-value.(e) State your
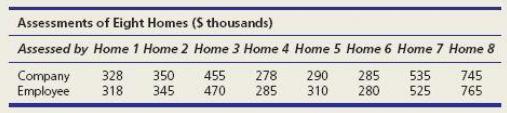
A certain company will purchase the house of any employee who is transferred out of state and will handle all details of reselling the house. The purchase price is based on two assessments, one assessor being chosen by the employee and one by the company. Based on the sample of eight assessments
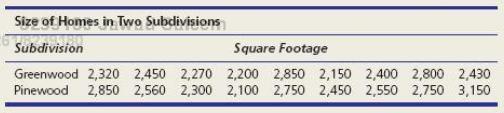
Nine homes are chosen at random from real estate listings in two suburban neighborhoods, and the square footage of each home is noted in the following table. At the .10 level of significance, is there a difference between the average sizes of homes in the two neighborhoods? State your hypotheses
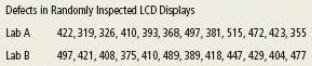
Two labs produce 1280 × 1024 LCD displays. At random, records are examined for 12 independently chosen hours of production in each lab, and the number of bad pixels per thou- sand displays is recorded.(a) Assuming equal variances, at the .01 level of significance, is there a difference in the
A cognitive retraining clinic assists outpatient victims of head injury, anoxia, or other conditions that result in cognitive impairment. Each incoming patient is evaluated to establish an appropriate treatment program and estimated length of stay. To see if the evaluation teams are consistent, 12
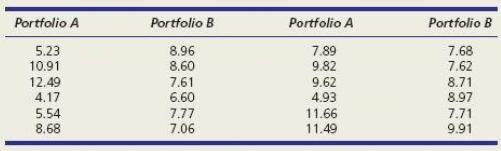
Rates of return (annualized) in two investment portfolios are compared over the last 12 quarters. They are considered similar in safety, but portfolio B is advertised as being "less volatile."(a) At α = .025, does the sample show that portfolio A has significantly greater variance in rates of
Is there a difference between the variance in ages for full-time seasonal employees and part-time seasonal employees at Vail Resorts? A sample of 62 full-time employees had an s12 = 265.69. A sample of 78 part-time employees had an s22 = 190.44.(a) Test for equal variances with α = .05.(b) If you
A survey of 100 mayonnaise purchasers showed that 65 were loyal to one brand. For 100 bath soap purchasers, only 53 were loyal to one brand. Form a 95 percent confidence interval for the difference of proportions. Does it include zero?
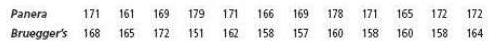
On a random basis, Bob buys a small take-out coffee from one of two restaurants. As a statistics project in the month of May, he measured the temperature of each cup immediately after purchase, using an analog cooking thermometer. Assuming equal variances, is the mean temperature higher at Panera
A 20-minute consumer survey mailed to 500 adults aged 2534 included a $5 Starbucks gift certificate. The same survey was mailed to 500 adults aged 2534 without the gift certificate. There were 65 responses from the first group and 45 from the second group. Form a 95 per- cent confidence
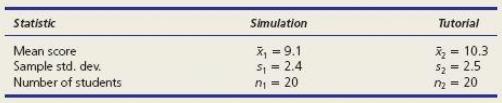
One group of accounting students used simulation programs, while another group received a tutorial. Scores on an exam were compared.(a) Construct a 90 percent confidence interval for the true difference in mean scores, explaining any assumptions that are necessary.(b) Do you think the learning
Advertisers fear that users of DVD recorders will "fast forward" past commercials when they watch a recorded program. A leading British pay television company told their advertisers that this effect might be offset because DVD users watch more TV. A sample of 15 DVD users showed a daily mean screen
In preliminary tests of a vaccine that may help smokers quit by reducing the "rush" from tobacco, 64 subjects who wanted to quit smoking were given either a placebo or the vaccine. Of the 32 in the placebo group, only 3 quit smoking for 30 days (the U.S. Food and Drug Administration's criterion for
Do positive emotions reduce susceptibility to colds? Healthy volunteers were divided into two groups based on their emotional pro les and each group was exposed to rhinovirus (the common cold). Of those who reported mostly positive emotions, 14 of 50 developed cold symptoms, compared with 23 of 56
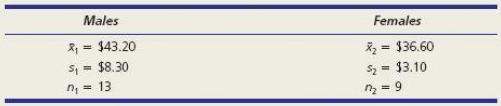
Male and female students in a finance class were asked how much their last tank of gas cost. Can you conclude that on average males spent more on gas than females?(a) State the hypotheses for this test.(b) Show the calculation of the test statistic, assuming unequal population variances.(c) State
Students in nutrition classes at two high schools were asked to keep track of the number of times during the past month that they ordered from a fast-food chain restaurant.(a) The re-search hypothesis is that Sonando High School students choose fast-food restaurants more often. State the hypotheses
For a marketing class term project, Bob is investigating whether college seniors eat less frequently in fast-food chains than college freshmen. He asked 11 freshmen and 11 seniors to keep track of how many times they ate in a fast-food restaurant during the month of October. Assuming equal
Using the following Excel results:(a) What was the overall sample size?(b) How many groups were there?(c) Write the hypotheses.(d) Find the critical value of F for α = .05.(e) Calculate the test statistic.(f) Do the population means differ at α = .05?
Consider a one-factor ANOVA with n1 = 6, n2 = 5, n3 = 4, n4 = 6, n5 = 4.(a) How many possible comparisons of means are there?(b) State the degrees of freedom for Tukey's T.(c) Find the critical value of Tukey's T for 5 .05.
Refer to Exercise 11.5. Which pairs of mean scrap rates differ significantly (3 plants)?Exercise 11.5Scrap rates per thousand (parts whose defects cannot be reworked) are compared for 5 randomly selected days at three plants. Do the data show a significant difference in mean scrap rates?
Refer to Exercise 11.6. Which pairs of mean examination times differ significantly (4 physicians)?Exercise 11.6One particular morning, the length of time spent in the examination rooms is recorded for each patient seen by each physician at an orthopedic clinic. Do the data show a significant
Refer to Exercise 11.7. Which pairs of mean GPAs differ significantly (4 majors)?Exercise 11.7Semester GPAs are compared for seven randomly chosen students in each class level at Oxnard University. Do the data show a significant difference in mean GPAs?
11.14 Refer to Exercise 11.8. Which pairs of mean weekly sales differ signi cantly (4 stores)?Exercise 11.8Sales of People magazine are compared over a 5-week period at four Borders outlets in Chicago. Do the data show a significant difference in mean weekly sales?
In a one-factor ANOVA with n1 = 6, n2 = 4, and n3 = 5, the sample variances were s21 = 1 121, s22 = 929, and s23 = 456. For Hartley's test:(a) State the hypotheses.(b) Calculate the 2 3 degrees of freedom.(c) Find the critical value at the 5 percent level of significance.(d) Calculate Hartley's
In a one-factor ANOVA with n1 = 7, n2 = 6, n3 = 5, n4 = 5, and n5 = 7, the sample standard deviations were s1 = 12, s2 = 24, s3 = 16, s4 = 46, and s5 = 27. For Hartley's test:(a) State the hypotheses.(b) Calculate the degrees of freedom.(c) Find the critical value at the 5 percent level of
Refer to Exercise 11.5. Are the population variances the same for scrap rates (3 plants)?Exercise 11.5Scrap rates per thousand (parts whose defects cannot be reworked) are compared for 5 randomly selected days at three plants. Do the data show a significant difference in mean scrap rates?
Refer to Exercise 11.6. Are the population variances the same for examination times (4 physicians)?Exercise 11.6One particular morning, the length of time spent in the examination rooms is recorded for each patient seen by each physician at an orthopedic clinic. Do the data show a significant
Refer to Exercise 11.7. Are the population variances the same for the GPAs (4 majors)?Exercise 11.7Semester GPAs are compared for seven randomly chosen students in each class level at Oxnard University. Do the data show a significant difference in mean GPAs?
Using the following Excel results:(a) What was the overall sample size?(b) How many groups were there?(c) Write the hypotheses.(d) Find the critical value of F for α = .10.(e) Calculate the test statistic.(f) Do the population means differ at α = .10?
Refer to Exercise 11.8. Are the population variances the same for weekly sales (4 stores)?Exercise 11.8Sales of People magazine are compared over a 5-week period at four Borders outlets in Chicago. Do the data show a significant difference in mean weekly sales?
Concerned about Friday absenteeism, management examined absenteeism rates for the last three Fridays in four assembly plants. Does this sample provide sufficient evidence to conclude that there is a significant difference in treatment means?
Engineers are testing company fleet vehicle fuel economy (miles per gallon) performance by using different types of fuel. One vehicle of each size is tested. Does this sample provide sufficient evidence to conclude that there is a significant difference in treatment means?
Five statistics professors are using the same textbook with the same syllabus and common exams. At the end of the semester, the department committee on instruction looked at aver- age exam scores. Does this sample provide sufficient evidence to conclude that there is a significant difference in
A beer distributor is comparing quarterly sales of Coors Light (number of six-packs sold) at three convenience stores. Does this sample provide sufficient evidence to conclude that there is a significant difference in treatment means?
A small independent stock broker has created four sector portfolios for her clients. Each portfolio always has five stocks that may change from year to year. The volatility (coefficient of variation) of each stock is recorded for each year. Are the main effects significant? Is there an interaction?
Oxnard Petro, Ltd., has three interdisciplinary project development teams that function on an ongoing basis. Team members rotate from time to time. Every 4 months (three times a year) each department head rates the performance of each project team (using a 0 to 100 scale, where 100 is the best
A market research firm is testing consumer reaction to a new shampoo on four age groups in four regions. There are five consumers in each test panel. Each consumer completes a 10-question product satisfaction instrument with a 5-point scale (5 is the highest rating) and the average score is
Oxnard Petro, Ltd., has three suppliers of catalysts. Orders are placed with each supplier every 15 working days, or about once every 3 weeks. The delivery time (days) is recorded for each Deliveries2 order over 1 year. Are the main effects significant? Is there an interaction?
Below are grade point averages for 25 randomly chosen university business students during a recent semester. Research question: Are the mean grade point averages the same for students in these four class levels?
In a one-factor ANOVA with sample sizes n1 = 5, n2 = 7, n3 = 6, n4 = 7, n5 = 5, the test statistic was Fcalc = 2.447.(a) State the hypotheses.(b) State the degrees of freedom for the test.(c) What is the critical value of F for α = .10?(d) What is your conclusion?(e) Write the Excel function for
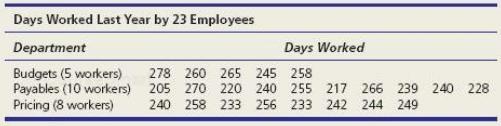
The XYZ Corporation is interested in possible differences in days worked by salaried employees in three departments in the financial area. A survey of 23 randomly chosen employees reveals the data shown below. Because of the casual sampling methodology in this survey, the sample sizes are unequal.
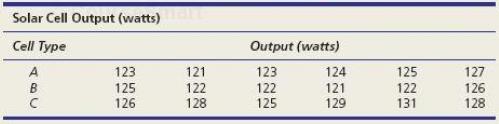
Mean output of solar cells of three types are measured six times under random light intensity over a period of 5 minutes, yielding the results shown. Research question: Is the mean solar cell output the same for all cell types?
In a bumper test, three types of autos were deliberately crashed into a barrier at 5 mph, and the resulting damage (in dollars) was estimated. Five test vehicles of each type were crashed, with the results shown below. Research question: Are the mean crash damages the same for Crash1 these three
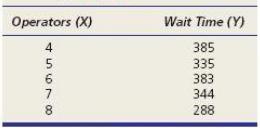
The waiting time (in minutes) for emergency room patients with non-life-threatening injuries was measured at four hospitals for all patients who arrived between 6:00 and 6:30 p.m. on a certain Wednesday. The results are shown below. Research question: Are the mean waiting times the same for
The results shown below are mean productivity measurements (average number of assemblies completed per hour) for a random sample of workers at each of three plants. Research question: Are the mean hourly productivity levels the same for workers in these three plants?
Below are results of braking tests of the Ford Explorer on glare ice, packed snow, and split traction (one set of wheels on ice, the other on dry pavement), using three braking methods. Research question: Is the mean stopping distance affected by braking method and/or by Braking surface type?
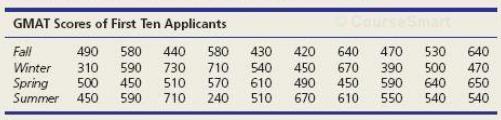
An MBA director examined GMAT scores for the first 10 MBA applicants (assumed to be a random sample of early applicants) for four academic quarters. Research question: Do the mean GMAT scores for early applicants differ by quarter?
An ANOVA study was conducted to compare dental offices in five small towns. The response variable was the number of days each dental office was open last year. Research question: Is DaysOpen there a difference in the means among these five towns?
The Environmental Protection Agency (EPA) advocates a maximum arsenic level in water of 10 micrograms per liter. Below are results of EPA tests on randomly chosen wells in a suburban Michigan county. Research question: Is the mean arsenic level affected by well depth Arsenic and/or age of well?
In a one-factor ANOVA with sample sizes n1 = 8, n2 = 5, n3 = 6, n4 = 6, the test statistic was F calc = 3.251.(a) State the hypotheses.(b) State the degrees of freedom for the test.(c) What is the critical value of F for α = .05?(d) What is your conclusion?(e) Write the Excel function for the
In a bumper test, three test vehicles of each of three types of autos were crashed into a barrier at 5 mph, and the resulting damage was estimated. Crashes were from three angles: head-on, slanted, and rear-end. The results are shown below. Research questions: Is the mean repair cost affected by
As a volunteer for a consumer research group, LaShonda was assigned to analyze the freshness of three brands of tortilla chips. She examined four randomly chosen bags of chips for four brands of chips from three different stores. She recorded the number of days from the current date until the
Three samples of each of three types of PVC pipe of equal wall thickness are tested to failure under three temperature conditions, yielding the results shown below. Research questions: Is mean burst strength affected by temperature and/or by pipe type? Is there a "best" brand of PVC pipe? Explain.
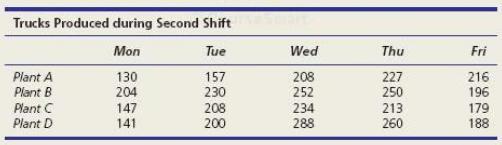
Below are data on truck production (number of vehicles completed) during the second shift at five truck plants for each day in a randomly chosen week. Research question: Are the mean Trucks production rates the same by plant and by day?
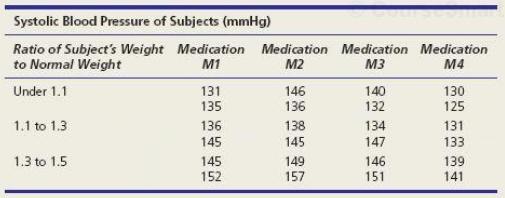
To check pain-relieving medications for potential side effects on blood pressure, it is decided to give equal doses of each of four medications to test subjects. To control for the potential effect of weight, subjects are classified by weight groups. Subjects are approximately the same age and are
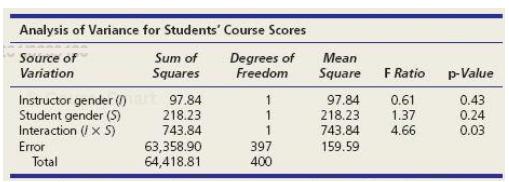
To assess the effects of instructor and student gender on student course scores, an experiment was conducted in 11 sections of managerial accounting classes ranging in size from 25 to 66 students. The factors were instructor gender (M, F) and student gender (M, F). There were 11 instructors (7
In a market research study, members of a consumer test panel are asked to rate the visual appeal (on a 1 to 10 scale) of the texture of dashboard plastic trim in a mockup of a new fuel cell car. The manufacturer is testing four finish textures. Panelists are assigned randomly to evaluate each
This table shows partial results for a one-factor ANOVA,(a) Calculate the F test statistic.(b) Calculate the p-value using Excel's function = F.DIST.RT (F,DF1,DF2).(c) Find the critical value F .05 from Appendix F or using Excel's function = F.INV.RT (.05,DF1,DF2).(d) Interpret the results.
(a) What kind of ANOVA is this (one-factor, two-factor, or two-factor with replication)? (b) Calculate each F test statistic.(b) Calculate the p-value for each F test using Excel's function = F.DIST.RT (F,DF1,DF2).(c) Interpret the results.
Here is an Excel ANOVA table for an experiment to assess the effects of ambient noise level and plant location on worker productivity.(a) What kind of ANOVA is this (one-factor, two- factor, two-factor replicated)?(b) Describe the original data format (i.e., how many rows, columns, and observations
Scrap rates per thousand (parts whose defects cannot be reworked) are compared for 5 randomly selected days at three plants. Do the data show a significant difference in mean scrap rates?
Several friends go bowling several times per month. They keep track of their scores over several months. An ANOVA was performed.(a) What kind of ANOVA is this (one-factor, two-factor, etc.)?(b) How many friends were there? How many months were observed? How many observations per bowler per month?
Air pollution (micrograms of particulate per ml of air) was measured along four freeways at each of five different times of day, with the results shown below.(a) What kind of ANOVA is this (one-factor, two-factor, etc.)?(b) What is your conclusion about air pollution? Explain, referring either to
A company has several suppliers of office supplies. It receives several shipments each quarter from each supplier. The time (days) between order and delivery was recorded for several randomly chosen shipments from each supplier in each quarter, and an ANOVA was performed. (a) What kind of
Several friends go bowling several times per month. They keep track of their scores over several months. An ANOVA was performed.(a) What kind of ANOVA is this (one-factor, two-factor, etc.)?(b) How could you tell how many friends there were in the sample just from the ANOVA table? Explain.(c) What
Are large companies more pro table per dollar of assets? The largest 500 companies in the world were ranked according to their number of employees, with groups defined as follows: Small = Under 25,000 employees, Medium = 25,000 to 49,999 employees, Large = 50,000 to 99,000 employees, Huge = 100,000
One particular morning, the length of time spent in the examination rooms is recorded for each patient seen by each physician at an orthopedic clinic. Do the data show a significant Physicians difference in mean times?
Semester GPAs are compared for seven randomly chosen students in each class level at Oxnard University. Do the data show a significant difference in mean GPAs?
Sales of People magazine are compared over a 5-week period at four Borders outlets in Chicago. Do the data show a significant difference in mean weekly sales?
Consider a one-factor ANOVA with n1 = 9, n2 = 10, n3 = 7, n4 = 8.(a) How many possible comparisons of means are there?(b) State the degrees of freedom for Tukey's T.(c) Find the critical value of Tukey's T for α = .05.
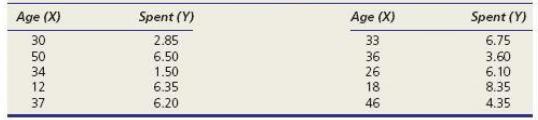
For each sample, do a test for zero correlation. (a) Use Appendix D to find the critical value of tα. (b) State the hypotheses about. (c) Perform the t test and report your decision.a. r = + .45, n = 20, α = .05, two-tailed testb. r = – .35, n = 30, α = .10, two-tailed testc. r = + .60, n = 7,
(a) Interpret the slope of the fitted regression Computer power dissipation = 15.73 + 0.032 Microprocessor speed, where Power dissipation is measured in watts and Microprocessor speed is measured in MHz. (b) What is the prediction for Power dissipation if Microprocessor speed is 3,000 MHz? (c) Is
(a) Interpret the slope of the fitted regression Number of International Franchises = 247.5 + 1.75 Power Distance Index. The Power Distance Index is a measure on a scale of 0100 of the wealth gap between the richest and poorest in a country. (b) What is the prediction for number of international
The regression equation NetIncome = 2,277 + .0307 Revenue was estimated from a sample of 100 leading world companies (variables are in millions of dollars). (a) Interpret the slope. (b) Is the intercept meaningful? Explain. (c) Make a prediction of NetIncome when Revenue = 20,000.
The regression equation HomePrice = 51.3 + 2.61 Income was estimated from a sample of 34 cities in the eastern United States. Both variables are in thousands of dollars. HomePrice is the median selling price of homes in the city, and Income is median family income for the city. (a) Interpret the
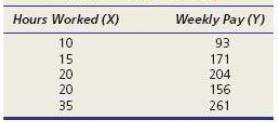
The regression equation Credits = 15.4 –.07 Work was estimated from a sample of 21 statistics students. Credits is the number of college credits taken and Work is the number of hours worked per week at an outside job. (a) Interpret the slope. (b) Is the intercept meaningful? Explain. (c) Make a
Below are fitted regressions for Y = asking price of a used vehicle and X = the age of the vehicle. The observed range of X was 1 to 8 years. The sample consisted of all vehicles listed for sale in a particular week.(a) Interpret the slope of each fitted regression.(b) Interpret the intercept of
Refer back to the regression equation in exercise 12.12: NetIncome = 2,277 + .0307 Revenue. Recall that the variables are both in millions of dollars.(a) Calculate the residual for the x, y pair ($41,078, $8,301). Did the regression equation underestimate or overestimate the net income?(b)
Refer back to the regression equation in exercise 12.14: Credits = 15.4 – .07 Work.(a) Calculate the residual for the x, y pair (14, 18). Did the regression equation underestimate or overestimate the credits?(b) Calculate the residual for the x, y pair (30, 6). Did the regression equation
College Students Weekly Earning in Dollars (n = 5)(a) Make an Excel worksheet to calculate SSxx, SSyy, and SSxy (the same worksheet you used in exercises 12.2 and 12.3).(b) Use the formulas to calculate the slope and intercept.(c) Use your estimated slope and intercept to make a worksheet to
Phone Hold Time For concert Tickets in Seconds (n = 5)(a) Make an Excel worksheet to calculate SSxx, SSyy, and SSxy (the same worksheet you used in exercises 12.2 and 12.3).(b) Use the formulas to calculate the slope and intercept.(c) Use your estimated slope and intercept to make a worksheet to
College Students Weekly Earnings in Dollars (n = 5)(a) Make an Excel scatter plot. What does it suggest about the population correlation between X and Y?(b) Make an Excel worksheet to calculate SSxx, SSyy, and SSxy. Use these sums to calculate the sample correlation coefficient. Check your work by
Moviegoer Snack Spending (n = 10)(a) Use Excel to make a scatter plot of the data.(b) Select the data points, right-click, select Add Trendline, select the Options tab, and choose Display equation on chart and Display R-squared value on chart.(c) Interpret the fitted slope.(d) Is the intercept
Annual Percent Return On Mutual Funds (n = 17)(a) Use Excel to make a scatter plot of the data. (b) Select the data points, right-click, select Add Trendline, select the Options tab, and choose Display equation on chart and Display R-squared value on chart. (c) Interpret the fitted slope. (d) Is
Order Size and Shipping Cost (n = 12)(a) Use Excel to make a scatter plot of the data. (b) Select the data points, right-click, select Add Trendline, select the Options tab, and choose Display equation on chart and Display R-squared value on chart. (c) Interpret the fitted slope. (d) Is the
College Students Weekly Earning in Dollars (n = 5)(a) Perform a regression using MegaStat or Excel.(b) State the null and alternative hypotheses for a two-tailed test for a zero slope.(c) Report the p-value and the 95 percent confidence interval for the slope shown in the regression results.(d) Is
Phone Hold Time for Concert Tickets in Seconds(a) Perform a regression using MegaStat or Excel.(b) State the null and alternative hypotheses for a two-tailed test for a zero slope.(c) Report the p-value and the 95 percent confidence interval for the slope shown in the regression results.(d) Is the
A regression was performed using data on 32 NFL teams in 2003. The variables were Y = current value of team (millions of dollars) and X = total debt held by the team owners (millions of dollars).(a) Write the fitted regression equation.(b) Construct a 95 percent confidence interval for the
A regression was performed using data on 16 randomly selected charities. The variables were Y = expenses (millions of dollars) and X = revenue (millions of dollars).(a) Write the fitted regression equation.(b) Construct a 95 percent confidence interval for the slope.(c) Perform a right-tailed t
Below is a regression using X = home price (000), Y = annual taxes (000), n = 20 homes.(a) Write the fitted regression equation.(b) Write the formula for each t statistic and verify the t statistics shown below.(c) State the degrees of freedom for the t tests and find the two-tail critical value
Below is a regression using X = average price, Y = units sold, n = 20 stores.(a) Write the fitted regression equation.(b) Write the formula for each t statistic and verify the t statistics shown below.(c) State the degrees of freedom for the t tests and find the two-tail critical value for t by
Moviegoer Snack Spending (n = 10)(a) Use Excel's Data Analysis > Regression (or MegaStat or MINITAB) to obtain regression estimates.(b) Interpret the 95 percent confidence interval for the slope. Does it contain zero?(c) Interpret the t test for the slope and its p-value.(d) Interpret the F
Phone Hold Time for Concert Tickets in Seconds(a) Make an Excel scatter plot. What does it suggest about the population correlation between X and Y?(b) Make an Excel worksheet to calculate SSxx, SSyy, and SSxy. Use these sums to calculate the sample correlation coefficient. Check your work by using
Annual Percent Return on Mutual Funds (n = 17)(a) Use Excel's Data Analysis > Regression (or MegaStat or MINITAB) to obtain regression estimates.(b) Interpret the 95 percent confidence interval for the slope. Does it contain zero?(c) Interpret the t test for the slope and its p-value.(d)
Order Size and Shipping Cost (n = 12)(a) Use Excel's Data Analysis > Regression (or MegaStat or MINITAB) to obtain regression estimates.(b) Interpret the 95 percent confidence interval for the slope. Does it contain zero?(c) Interpret the t test for the slope and its p-value.(d) Interpret the F
Refer to the Weekly Earnings data set below.(a) Use MegaStat or MINITAB to find confidence and prediction intervals for Y using the following set of x values: 12, 17, 21, 25, and 30.(b) Report the 95 percent confidence interval and prediction interval for x = 17.(c) Calculate the 95 percent
Refer to the Revenue and Pro t data set below. Data are in billions of dollars.(a) Use Mega-Stat or MINITAB to find confidence and prediction intervals for Y using the following set of x values: 1.8, 15, and 30.(b) Report the 95 percent confidence interval and prediction interval for x = 15.(c)
Showing 26200 - 26300
of 88243
First
256
257
258
259
260
261
262
263
264
265
266
267
268
269
270
Last
Step by Step Answers
.png)
.png)
.png)
.png)
.png)

.png)
.png)
.png)
.png)
.png)
.png)
.png)
.png)
.png)
.png)
.png)
.png)
.png)
.png)
.png)
.png)
.png)
.png)
.png)
.png)
.png)
.png)
.png)
.png)
.png)
.png)
.png)
.png)
.png)
.png)
.png)
.png)
.png)
.png)
.png)
.png)
.png)
.png)
.png)
.png)
.png)
.png)
.png)
.png)
.png)
.png)
.png)
.png)
.png)
.png)
.png)
.png)
.png)
.png)


