New Semester
Started
Get
50% OFF
Study Help!
--h --m --s
Claim Now
Question Answers
Textbooks
Find textbooks, questions and answers
Oops, something went wrong!
Change your search query and then try again
S
Books
FREE
Study Help
Expert Questions
Accounting
General Management
Mathematics
Finance
Organizational Behaviour
Law
Physics
Operating System
Management Leadership
Sociology
Programming
Marketing
Database
Computer Network
Economics
Textbooks Solutions
Accounting
Managerial Accounting
Management Leadership
Cost Accounting
Statistics
Business Law
Corporate Finance
Finance
Economics
Auditing
Tutors
Online Tutors
Find a Tutor
Hire a Tutor
Become a Tutor
AI Tutor
AI Study Planner
NEW
Sell Books
Search
Search
Sign In
Register
study help
mathematics
statistics
Applied Statistics In Business And Economics 4th Edition David Doane, Lori Seward - Solutions
(a) Plot the data on skier/snowboard visits.(b) Would a fitted trend be helpful? Explain.(c) Make a forecast for 20072008, using a trend model of your choice (or a judgment forecast).
(a) Plot both men's and women's winning times on the same graph.(b) Fit a linear trend model to each series (men, women).(c) Use Excel's option to forecast each trend graphically to 2040 (i.e., to period t = 27 periods because observations are in 4-year increments). From these projections, does it
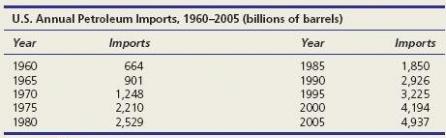
(a) Plot U.S. petroleum imports on a graph.(b) Describe the trend (if any) and discuss possible causes.(c) Fit both a linear and an exponential trend.(c) Interpret each fitted trend equation, explaining the implications.(d) Make a projection for 2010. Do you believe it?(e) To whom is this issue
(a) Use Excel, MegaStat, or MINITAB to t an m-period moving average to the exchange rate data shown below with m = 2, 3, 4, and 5 periods. Make a line chart.(b) Which value of m do you prefer? Why?(c) Is a moving average appropriate for this kind of data? Include a chart for each value of m.
Refer to exercise 14.26. (a) Plot the dollar/pound exchange rate data. Make the graph nice, then copy and paste it so you have four copies. (b) Use MegaStat or MINITAB to perform a simple exponential smoothing using α = .05, .10, .20, and .50, using a different line chart for each. (c) Which
(a) Plot the data on gas bills.(b) Can you see seasonal patterns? Explain.(c) Use MegaStat or MINITAB to calculate estimated seasonal indexes and trend.(d) Which months are the most expensive? The least expensive? Can you explain this pattern?(e) Is there a trend in the de- seasonalized data? *(f)
(a) Plot the data on air travel delays.(b) Can you see seasonal patterns? Explain.(c) Use MegaStat or MINITAB to calculate estimated seasonal indexes and trend.(d) Which months have the most delays? The fewest? Is this logical?(e) Is there a trend in the deseasonalized Delays data?
(a) Make an Excel line graph of the data on employee work stoppages.(b) Discuss the under- lying causes that might explain the trend or pattern.(c) Fit three trends (linear, exponential, quadratic).(d) Which trend model is best, and why? If none is satisfactory, explain.(e) Make numerical forecasts
(a) Plot the data on airplane shipments.(b) Can you see seasonal patterns? Explain.(c) Use MegaStat or MINITAB to calculate estimated seasonal indexes and trend. Is there a trend in the deseasonalized data?
(a) Plot the data on revolving credit (credit cards and home equity lines of credit are the two major types of revolving credit).(b) Use MegaStat or MINITAB to calculate seasonal indexes and trend. Is there a trend in the deseasonalized data?(c) Which months have the most borrowing? The least? Is
(a) Use MegaStat or MINITAB to deseasonalize the quarterly data on Coca-Cola's revenues and t a trend. Interpret the results.(b) Use MegaStat or MINITAB to perform a regres- sion using seasonal binaries. Interpret the results.(c) Use the regression equation to make a prediction for each quarter in
(a) Use MegaStat or MINITAB to perform a regression using seasonal binaries. Interpret the results.(b) Make monthly forecasts for 2010. If you can nd data on the web, check your forecasts.
(a) Make an Excel line graph of the car dealership data.(b) Discuss the underlying causes that might explain the trend or pattern.(c) Fit three trends (linear, exponential, quadratic).(d) Would any of the three trend models yield adequate forecasts? Explain.
(a) Plot the data on fruit and vegetable consumption.(b) Discuss the underlying causes that might explain the trend or pattern.(c) Fit a linear trend to the data.(d) Interpret the trend equation. What are its implications for producers?(e) Make a forecast for 2010. Note: Time Fruits increments are
(a) Make an Excel line graph of the exchange rate data. Describe the pattern.(b) Click on the data and choose Add Trendline > Moving Average. Describe the effect of increasing m (e.g., m = 2, 4, 6, etc.). Include a copy of each graph with your answer.(c) Discuss how this moving aver- age might
(a) Make an Excel line graph of the following bond yield data. Describe the pattern. Is there a consistent trend?(b) Use exponential smoothing (MegaStat, MINITAB, or Excel) with α = .20. Use both methods A and B to initialize the forecast (the default in both MegaStat and MINITAB).(c) Record the
(a) Use MegaStat or MINITAB to deseasonalize the quarterly data on PepsiCo's revenues and t a trend. Interpret the results.(b) Use MegaStat or MINITAB to perform a regression using seasonal binaries. Interpret the results.(c) Use the regression equation to make a prediction for each quarter in 2011.
(a) Use MegaStat or MINITAB to deseasonalize the monthly Corvette sales data and t a trend. Interpret the results.(b) Use MegaStat or MINITAB to perform a regression using seasonal binaries. Interpret the results.(c) Use the regression equation to make a prediction for each month in 2008.
In a study of how managers attempt to manage earnings, researchers analyzed a sample of 515 earnings-management attempts from a survey of experienced auditors. The frequency of effects is summarized in the table shown. Research question: At α = .01, is the effect on earn- ings independent of the
In a three-digit lottery, each of the three digits is supposed to have the same probability of occurrence (counting initial blanks as zeros, e.g., 32 is treated as 032). The table shows the frequency of occurrence of each digit for 90 consecutive daily three-digit drawings.(a) Make a bar chart and
Ages of 56 attendees of a Harry Potter movie are shown.(a) Form seven age classes (10 to 20, 20 to 30, etc.). Tabulate the frequency of attendees in each class.(b) Calculate expected frequencies for each class.(c) Perform a chi-square GOF test for a uniform distribution, using the 5 percent level
Excel was asked to generate 50 Poisson random numbers with mean λ = 5.(a) Calculate the sample mean. How close is it to the desired value?(b) Calculate the expected frequencies assuming a Poisson distribution with λ = 5. Show your calculations in a spreadsheet format.(c) Carry out the
During the 197374 hockey season, the Boston Bruins played 39 home games and scored 193 points, as shown below.(a) Estimate the mean from the sample.(b) Calculate the expected frequencies assuming a Poisson distribution. Show your calculations in a spread- sheet format.(c) Carry out the chi-square
At a local supermarket receiving dock, the number of truck arrivals per day is recorded for 100 days.(a) Estimate the mean from the sample.(b) Calculate the expected frequencies assuming a Poisson distribution. Show your calculations in a spreadsheet format.(c) Carry out the chi-square test,
Exam scores of 40 students in a statistics class are shown.(a) Estimate the mean and standard deviation from the sample.(b) Assuming that the data are from a normal distribution, de ne bins by using method 3 (equal expected frequencies). Use 8 bins.(c) Set up an Excel worksheet for your chi-square
One Friday night, there were 42 carry-out orders at Ashoka Curry Express.(a) Estimate the mean and standard deviation from the sample.(b) Assuming that the data are from a normal distribution, de ne bins by using method 3 (equal expected frequencies). Use 8 bins.(c) Set up an Excel worksheet for
Use MINITAB's Stat > Basic Statistics > Normality Test to obtain a probability plot for the exam score data (see Exercise 15.15). Interpret the probability plot and Anderson-Darling statistic. Was MINITAB easier to use than the chi-square test?
Use MINITAB's Stat > Basic Statistics > Normality Test to obtain a probability plot for the Ashoka Curry House carry-out order data (see Exercise 15.16). Interpret the probability plot and Anderson-Darling statistic. Was MINITAB easier to use than the chi-square test?
Employees of Axolotl Corporation were sampled at random from pay records and asked to complete an anonymous job satisfaction survey, yielding the tabulation shown. Research Employees question: At α = .05, is job satisfaction independent of pay category?
Teenagers make up a large percentage of the market for clothing. Below are data on running shoe ownership in four world regions (excluding China). Research question: At α = .01, does this sample show that running shoe ownership depends on world region?
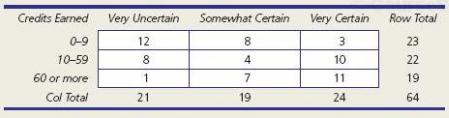
Sixty-four students in an introductory college economics class were asked how many credits they had earned in college, and how certain they were about their choice of major. Research question: At α = .01, is the degree of certainty independent of credits earned?
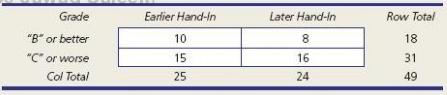
To see whether students who nish an exam rst get the same grades as those who nish later, a professor kept track of the order in which papers were handed in. Of the rst 25 papers, 10 received a "B" or better, compared with 8 of the last 24 papers handed in. Research ques- tion: At α = .10, is
From 74 of its restaurants, Noodles & Company managers collected data on per-person sales and the percent of sales due to "potstickers" (a popular food item). Both numerical variables failed tests for normality, so they tried a chi-square test. Each variable was converted into ordinal
A web-based anonymous survey of students asked for a self-rating on proficiency in a language other than English and the student's frequency of newspaper reading. Research question: At α = .10, is frequency of newspaper reading independent of foreign language proficiency?
A student team examined parked cars in four different suburban shopping malls. One hundred vehicles were examined in each location. Research question: At α = .05, does vehicle type vary by mall location? (Data are from a project by MBA students Steve Bennett, Alicia Morais, Steve Olson, and Greg
Choose either 2 × 2 contingency table shown below (males or females). Research question: At α = .005, is smoking independent of race? (Smoking rates are from Statistical Abstract of the United States, 2001, pp. 16 and 12, applied to hypothetical samples of 500.)
High levels of cockpit noise in an aircraft can damage the hearing of pilots who are exposed to this hazard for many hours. A Boeing 727 co-pilot collected 61 noise observations using a handheld sound meter. Noise level is defined as "Low" (under 88 decibels), "Medium" (88 to 91 decibels), or
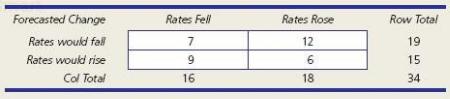
Forecasters' interest rate predictions over an eight-year period were studied to see whether the predictions corresponded to what actually happened. The 2 × 2 contingency table below shows the frequencies of actual and predicted interest rate movements. Research question: At α = .10, is the
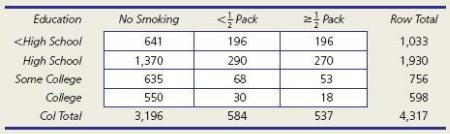
In a study of childhood asthma, 4,317 observations were collected on education and smoking during pregnancy, shown in the 4 × 3 contingency table below. Research question: At α = .005, is smoking during pregnancy independent of education level?
Two contingency tables below show return on investment (ROI) and percent of sales growth over the previous 5 years for 85 U.S. rms. ROI is defined as percentage of return on a combination of stockholders' equity (both common and preferred) plus capital from long-term debt including current
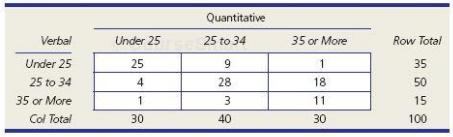
Students applying for admission to an MBA program must submit scores from the GMAT test, which includes a verbal and a quantitative component. Shown here are raw scores for 100 randomly chosen MBA applicants at a Midwestern, public, AACSB-accredited business school. Research question: At α =
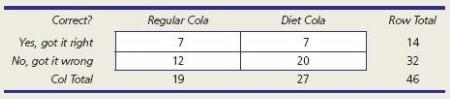
Can people really identify their favorite brand of cola? Volunteers tasted Coke, Pepsi, Diet Coke, and Diet Pepsi, with the results shown below. Research question: At α = .05, is the correctness of the prediction different for regular cola and diet cola drinkers? Since it is a 2 × 2 table,
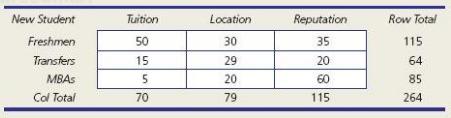
A survey of randomly chosen new students at a certain university revealed the data below concerning the main reason for choosing this university instead of another. Research question: At α = .01, is the main reason for choosing the university independent of student type?
A survey of 189 statistics students asked the age of car usually driven and the student's political orientation. The car age was a numerical variable, which was converted into ordinal categories. Research question: At α = .10, are students' political views independent of the age of car they
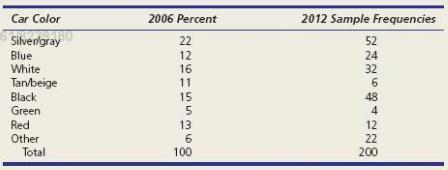
The actual distribution of car colors for 2006 model car buyers is shown below. Based on the sample of 200 car buyers for 2012 model vehicles, use the multinomial chi-square GOF test at α = .05 to test whether car buyers' color preferences have changed.
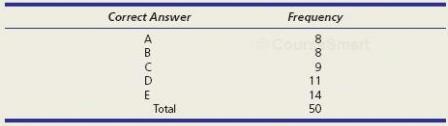
Prof. Green's multiple-choice exam had 50 questions with the distribution of correct answers shown below. Research question: At α = .05, can you reject the hypothesis that Green's exam answers came from a uniform population?
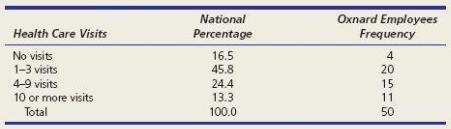
Oxnard Kortholt, Ltd., employs 50 workers. During the last year, the company noted the number of visits with health care professionals (doctor, emergency, home) for each of its employees. U.S. national percentages are also shown. Research question: At α = .05, do Oxnard employees differ
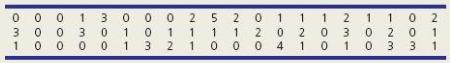
In a four-digit lottery, each of the four digits is supposed to have the same probability of occurrence. The table shows the frequency of occurrence of each digit for 89 consecutive daily four-digit drawings. Research question: At α = .01, can you reject the hypothesis that the digits are from a
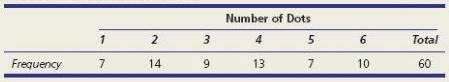
A student rolled a supposedly fair die 60 times, resulting in the distribution of dots shown. Research question: At α = .10, can you reject the hypothesis that the die is fair?
The World Cup soccer tournament is held every 4 years, with 32 teams from various nations competing. In the World Cup tournaments between 1990 and 2002, there were 232 games with the distribution of goals shown in this worksheet. Research question: At α = .025, can you reject the hypothesis that
The table below shows the number of ATM customer arrivals per minute in 60 randomly chosen minutes. Research question: At α = .025, can you reject the hypothesis that the number of ATM arrivals per minute follows a Poisson process?
Computer abuse by employees is an ongoing worry to businesses. A study revealed the data shown below. Research question: At α = .01, is the frequency of disciplinary action independent of the abuser's level of privilege? (Data are from Detmar W. Straub and William D. Nance, "Discovering and
Pick one Excel data set (A through F) and investigate whether the data could have come from a normal population using α = .01. Use any test you wish, including a histogram, or MegaStat's Descriptive Statistics > Normal curve goodness of fit test, or MINITAB's Stats > Basic Statistics >
In 2002, the Anaheim Angels defeated the San Francisco Giants in the World Series 4 games to 3. The table below shows the inning-by-inning breakdown of runs by each team (3 indicates unnecessary last half of inning).(a) Estimate (the mean runs per game).(b) Use Excel's function
Refer to the previous problem. In the 2002 World Series, a total of 85 runs were scored.(a) Before doing any calculations, based on your understanding of baseball, why might runs per inning not be uniform?(b) Complete the tabulation below, by counting the frequency of runs in each of the nine
(a) Use either MINITAB or MegaStat or Excel's function = NORM.INV (RAND (),0,1) or Excel's Data Analysis > Random Numbers to generate 100 normally distributed random numbers with a mean of 0 and a standard deviation of 1.(b) Make a histogram of your sample and assess its shape. Are there
(a) Use either MegaStat or Excel's function = RAND () or Excel's Data Analysis > Random Numbers to generate 100 uniformly distributed random numbers between 0 and 1.(b) Make a histogram of your sample and assess its shape.(c) Calculate descriptive statistics. Are the sample mean and _____
(a) Use Excel's Data Analysis > Random Numbers to generate 100 Poisson-distributed random numbers with a mean of λ = 4. (b) Make a histogram of your sample and assess its shape. (c) Calculate descriptive statistics. __ the sample mean and standard deviation close to their Are __
Refer back to Table 15.11, which shows the distribution of the number of U.S. Supreme Court appointments per year from 19001999. Since 1999 there have been four Supreme Court appointments with one each in the years 2005, 2006, 2009, and 2010. Redo the Poisson GOF test to determine if the
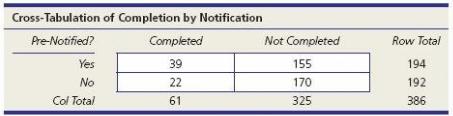
Marketing researchers sent an advance e-mail notice announcing an upcoming Internet survey and describing the purpose of their research. Half the target customers received the prenotification, followed by the survey. The other half received only the survey. The survey completion frequencies are
U.S. market share for smartphones with larger screens is increasing. As of the first quarter of 2011, smartphones with screens 4 inches or larger had captured 24 percent of the smartphone market. The market for smartphones with screens between 3.5 and 3.9 inches has stayed fairly steady at 40
Market research has shown that Americans will continue to eat out even in a depressed economy. A market analysis during the most recent recession showed the following distribution of visits to the various types of restaurants:Fast food (36%)Quick casual (29%)Casual dining (15%)Family style
Advertisers need to know which age groups are likely to see their ads. Purchasers of 120 copies of Cosmopolitan are shown by age group.(a) Make a bar chart and describe it.(b) Calculate expected frequencies for each class.(c) Perform the chi-square test for a uniform distribution. At α = .01,
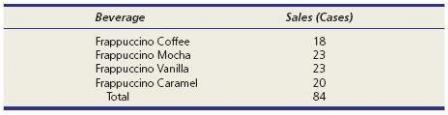
One-year sales volume of four similar 20-oz. beverages on a college campus is shown.(a) Make a bar chart and describe it.(b) Calculate expected frequencies for each class.(c) Perform the chi-square test for a uniform distribution. At 5 .05, does this sample con- tradict the assumption that sales
Using α = .05, perform a runs test for randomness on the sample data (n 5 27).AABBAABBABAABBBAABBBBAABABB
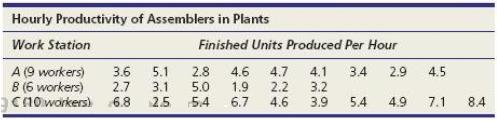
The results shown below are mean productivity measurements (average number of assemblies completed per hour) for a random sample of workers at each of three work stations.(a) At α = .05, is there a difference in median productivity? Use MegaStat, MINITAB, or a similar computer package for the
Consumers are asked to rate the attractiveness of four potential dashboard surface textures on an interval scale (1 = least attractive, 10 = most attractive). Use MegaStat or another software package to perform a Friedman test to see whether the median ratings of surfaces differ at α = .05,
JavaMax is a neighborhood take-out coffee shop that offers three sizes. Yesterday's sales are shown. Use MegaStat or another software package to perform a Friedman test to see whether the median sales of coffee sizes differ at α = .05, using time of day as the blocking Coffee factor.
Profits of 20 consumer food companies are shown.(a) Convert the data to ranks. Check the column sums.(b) Calculate Spearman's rank correlation coefficient. Show your calculations.(c) At α = .01 can you reject the hypothesis of zero rank correlation?(d) Check your work by using MegaStat.(e)
Rates of return on 24 mutual funds are shown.(a) Convert the data to ranks. Check the column sums.(b) Calculate Spearman's rank correlation coefficient. Show your calculations.(c) At α = .01 can you reject the hypothesis of zero rank correlation?(d) Check your work by using MegaStat.(e)
A supplier of laptop PC power supplies uses a control chart to track the output (in watts) of each unit produced. The pattern below shows whether each unit's output was above(a) Or below(b) The desired specification. Research question: At α = .05, do the deviations follow a random pattern?
A basketball player took 35 free throws during the season. Her sequence of hits (H) and misses (M) is shown. Research question: At α = .01, is her hit/miss sequence random?HMMHHMHMMHHHHHMMHHMMHMHHHMHHHHMMMHH
Thirty-four customers at Starbucks either ordered coffee (c) or did not order coffee (X). Research question: At α = .05, is the sequence random?CXCXCCCCXXXXCXCXCXCCCXCXCCXCXXXCCX
The price of a particular stock over a period of 60 days rises (1) or declines (2) in the following pattern. Research question: At α = .05, is the pattern random?
A forecasting model is fitted to sales data over 24 months. Forecasting errors are tabulated to reveal whether the model provides an overestimate (1) or an underestimate (2) for each month's sales. The results are – – + + + – + – – + + – – – – – – + + + + + – –. Research
Using α = .10, perform a runs test for randomness on the sample data (n = 24).XOXXXXOOOOXOOOXOOOXOOXXO
A cognitive retraining clinic assists outpatient victims of head injury, anoxia, or other conditions that result in cognitive impairment. Each incoming patient is evaluated to establish an appropriate treatment program and estimated length of stay (ELOS is always a multiple of 4 weeks because
Two manufacturing facilities produce 1280 × 1024 LED (light-emitting diode) displays. Twelve shipments are tested at random from each lab, and the number of bad pixels per billion is noted for each shipment. Research question: At α = .05, do the medians differ?
Salaries of 30 randomly chosen individuals in the same occupation (only the first 3 and last 3 observations are shown). The data are from a salary equity study comparing two industries. Research question: Without assuming normality of the populations, is there a difference in the medians at α =
Does a class break stimulate the pulse? Here are heart rates for a sample of 30 students before and after a class break. Research question: At α = .05, do the medians differ?
An experimental bumper was designed to reduce damage in low-speed collisions. This bumper was installed on an experimental group of vans in a large feet, but not on a control group. At the end of a trial period, accident data showed 12 repair incidents for the experimental group and 9 repair
The square footage of each of the last 11 homes sold in each of two suburban neighbor- hoods is noted. Research question: At α = .01, do the medians differ?
Below are grade point averages for 25 randomly chosen university business students during a recent semester. Research question: At α = .01, are the median grade point averages the same for students in these four class levels?
In a bumper test, three types of autos were deliberately crashed into a barrier at 5 mph, and the resulting damage (in dollars) was estimated. Five test vehicles of each type were crashed, with the results shown below. Research question: At α = .01, are the median crash damages the same for
The waiting time (in minutes) for emergency room patients with non-life-threatening injuries was measured at four hospitals for all patients who arrived between 6:00 and 6:30 p.m. on a certain Wednesday. The results are shown below. Research question: At α = .05, are the median waiting times the
Mean output of arrays of solar cells of three types are measured four times under random light intensity over a period of 5 minutes, yielding the results shown below. Research question: At α = .05, is the median solar cell output the same for all three types?
On a professional certifying exam, there are 25 true-false questions. The correct answers are T F T T F F F T T F T F T T T F F T T F F T T F T. Research question: At α = .05, is the T/F pattern random?
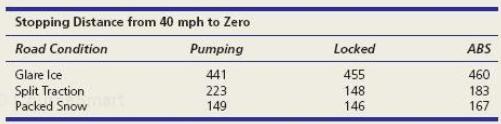
Below are results of braking tests of the Ford Explorer on glare ice, packed snow, and split traction (one set of wheels on ice, the other on dry pavement), using three braking methods. Research question: At α = .01, is braking method related to stopping distance?
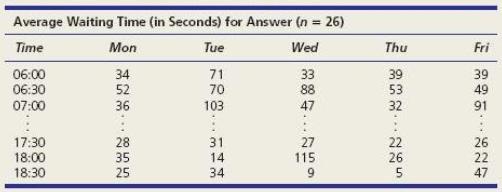
In a call center, the average waiting time for an answer (in seconds) is shown below by time of day. Research question: At α = .01, does the waiting time differ by day of the week? Note: Wait Only the first 3 and last 3 observations are shown.
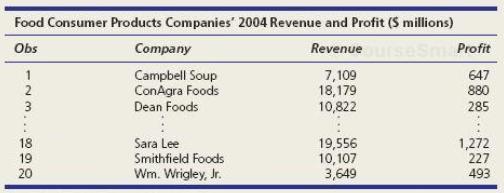
The table below shows annual financial data for a sample of 20 companies in the food consumer products sector. Research question: At α = .01, is there a significant correlation between revenue and pro t? Why is a rank correlation preferred? What factors might result in a less- than-perfect
Fertility rates (children born per woman) are shown for 27 EU member nations in 2 years. Research question: At α = .05, is there a significant rank correlation? Only the first 3 Fertility and last 3 nations are shown.
A newspaper article listed nutritional facts for 56 frozen dinners. From that list, 16 frozen dinners were randomly selected by using the random number method. Research question: Choose any two variables. At α = .01, based on this sample, is there a significant rank correlation between the two
The table below shows ratings of 18 movies by two reviewers (on a 0 to 5 scale using half (increments). Research question: At α = .05, based on these data, is the rank correlation between reviewers significantly greater than zero (i.e., a right-tail test)?
Are gasoline prices a potential policy tool in controlling carbon emissions? The table below shows 2001 gasoline prices (dollars per liter) and carbon dioxide emissions per dollar of GDP. Research question: At α = .05, based on these data, is there a significant rank correlation between these
Below are the top 20 U.S. football teams in the seventh and eighth weeks of the 2003 season, along with the points awarded to each team by the ESPN/USA Today coaches poll. Research question: At α = .01, based on these data, does the true rank correlation differ from zero for these two ratings?
A baseball player was at bat 33 times during preseason exhibition games. His pattern of hits (H) and nonhits (N) is shown (a nonhit is a walk or a strikeout). Research question: At 5 .01, is the pattern of hits random?NNNHNHNNHNNHHNNNNHNHNNNHNNHNHNNHH
A sample of 28 student scores on the chemistry midterm exam is shown.(a) At 5 .10, does the population median differ from 50? Make a worksheet in Excel for your calculations.(b) Make a histogram of the data. Would you be justified in using a parametric t test that assumes normality? Explain.
Final exam scores for a sample of 20 students in a managerial accounting class are shown.(a) At α = .05, is there a difference in the population median scores on the two exams? Make an Excel worksheet for your Wilcoxon signed-rank test calculations and check your work by using MegaStat or a
Bob and Tom are "paper investors." They each "buy" stocks they think will rise in value and "hold" them for a year. At the end of the year, they compare their stocks' appreciation (percent).(a) At α = .05, is there a difference in the medians (assume these are samples of Bob's and Tom's
An experimental bumper was designed to reduce damage in low-speed collisions. This bum- per was installed on an experimental group of vans in a large eet, but not on a control group. At the end of a trial period, there were 12 repair incidents (a "repair incident" is an accident that resulted in a
Showing 26400 - 26500
of 88243
First
258
259
260
261
262
263
264
265
266
267
268
269
270
271
272
Last
Step by Step Answers
.png)
-1.png)
-2.png)
.png)
.png)
.png)
.png)
.png)
.png)
.png)
.png)
.png)
.png)
.png)
.png)
.png)
.png)
.png)
.png)
.png)
.png)
.png)
.png)
.png)
.png)
.png)
.png)
.png)
.png)
-1.png)
-2.png)
.png)
.png)
.png)
.png)
-1.png)
-2.png)
-3.png)
-1.png)
-2.png)
.png)
.png)
.png)
.png)
.png)
.png)
.png)
.png)
.png)
.png)
.png)
.png)
.png)
.png)
.png)
.png)
.png)