New Semester
Started
Get
50% OFF
Study Help!
--h --m --s
Claim Now
Question Answers
Textbooks
Find textbooks, questions and answers
Oops, something went wrong!
Change your search query and then try again
S
Books
FREE
Study Help
Expert Questions
Accounting
General Management
Mathematics
Finance
Organizational Behaviour
Law
Physics
Operating System
Management Leadership
Sociology
Programming
Marketing
Database
Computer Network
Economics
Textbooks Solutions
Accounting
Managerial Accounting
Management Leadership
Cost Accounting
Statistics
Business Law
Corporate Finance
Finance
Economics
Auditing
Tutors
Online Tutors
Find a Tutor
Hire a Tutor
Become a Tutor
AI Tutor
AI Study Planner
NEW
Sell Books
Search
Search
Sign In
Register
study help
mathematics
statistics
The Essentials Of Statistics A Tool For Social Research 3rd Edition Joseph F. Healey - Solutions
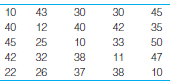
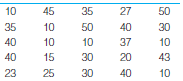
For the test scores first presented in problem 2.6 and reproduced here, compute a median and mean for the pretest and posttest and then interpret these statistics.
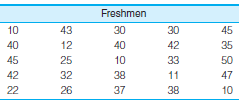
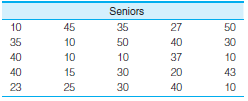
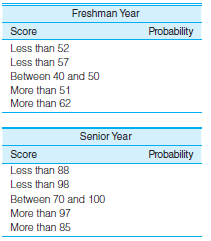
A sample of 25 freshmen at a major university completed a survey that measured their degree of racial prejudice (the higher the score, the greater the prejudice).a. Compute the median and mean scores for these data.b. These same 25 students completed the same survey during their senior year.
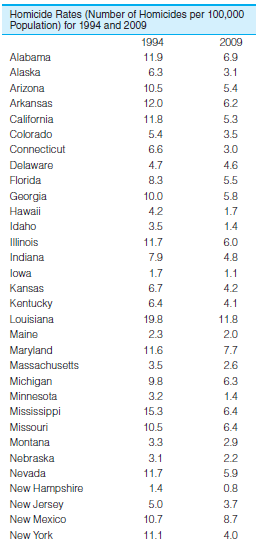
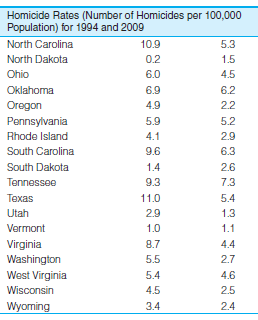
The table below presents the homicide rates for the 50 states for two different years.a. Calculate the mean and median rates for both years. Remember to rank-order the states before finding the median.b. Compare the mean and median for each year separately. Which is the higher value? Why?c. If you
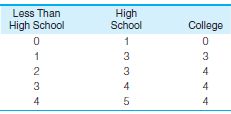
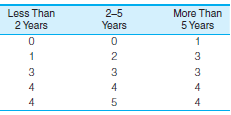
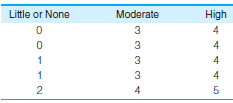
A variety of information have been collected for all district high schools. Find the most appropriate measure of central tendency for each variable and summarize this information in a paragraph.
You have been observing the local Democratic Party in a large city and have compiled some information about a small sample of party regulars.Find the appropriate measure of central tendency for each variable.
You have compiled the following information on each of the graduates voted "most likely to succeed" by a local high school for a 10-year period.For each variable, find the appropriate measure of central tendency.
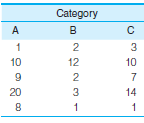
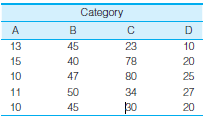
For 15 respondents, data have been gathered on four variables (see the following table). Find and report the appropriate measure of central tendency for each variable.
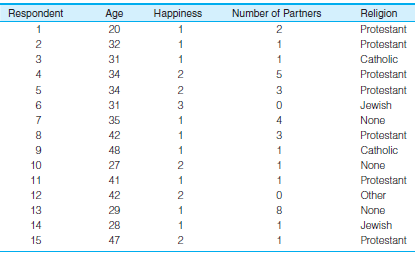
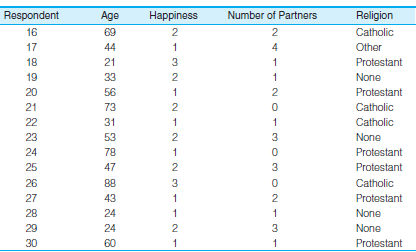
Following are four variables for 30 cases from the General Social Survey. Age is reported in years. The variable happiness consists of answers to the question "Taken all together, would you say that you are (1) very happy (2) pretty happy, or (3) not too happy?" Respondents were asked how many sex
Find the appropriate measure of central tendency for each variable displayed in Problem 2.5. Report each statistic as you would in a formal research report.
The following table lists the median family incomes for 13 Canadian provinces and territories in 2000 and 2006. Compute the mean and median for each year and then compare the two measures of central tendency. Which measure of central tendency is greater for each year? Are the distributions skewed?
The administration is considering a total ban on student automobiles. You have conducted a poll on this issue of 20 fellow students and 20 of the neighbors who live around the campus and have calculated scores for your respondents. On the scale you used, a high score indicates strong opposition to
Per capita expenditures for police protection for 20 cities are reported here for 2000 and2010. Compute a mean and standard deviation for each year and then describe the differences in expenditures for the five-year period.
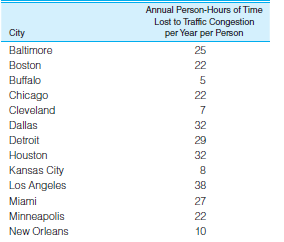
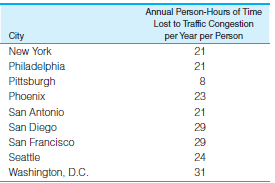
Compute the range and standard deviation for the data presented in problem 3.14. The data are reproduced here. What would happen to the value of the standard deviation if you removed Los Angeles from this distribution and recalculated? Why?
Listed here are the rates of abortion per 100,000 women for 20 states in 1973 and 1975.Describe what happened to these distributions over the two-year period. Did the average rate increase or decrease? What happened to the dispersion of this distribution? What happened between 1973 and 1975 that
One of your goals as the new chief administrator of a large social service bureau is to equalize workloads within the various divisions of the agency. You have gathered data on caseloads per worker within each division. Which division comes closest to the ideal of an equalized workload? Which his
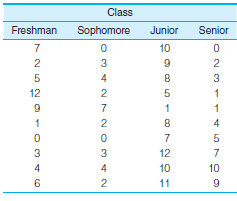
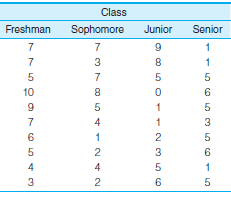
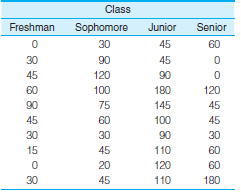
Compute the standard deviation for both sets of data presented in problem 3.13 and reproduced here. Compare the standard deviation computed for freshmen with the standard deviation computed for seniors. What happened? Why? Does this change relate at all to what happened to the mean over the
In problem 3.1 at the end of Chapter 3, you calculated measures of central tendency for six variables for freshman and seniors. Three of those variables are reproduced here. Calculate the mean (if necessary), the range, and the standard deviation for each variable. What information is added by the
In problem 3.5 at the end of Chapter 3, you calculated measures of central tendency for four variables for 15 respondents. Two of those variables are reproduced here. Calculate the mean (if necessary), the range, and the standard deviation for each variable.What information is added by the measures
In problem 3.8, you computed mean and median income for 13 Canadian provinces and territories in two separate years. Now compute the standard deviation and range for each year, and taking account of the two measures of central tendency and the two measures of dispersion, write a paragraph
Data on several variables measuring overall health and well-being for five nations are reported here for 2005, with projections to 2020. Are nations becoming more or less diverse on these variables? Calculate the mean, range, and standard deviation for each year for each variable. Summarize the
Labor force participation rates (percent employed), percent high school graduates, and mean income for males and females in 10 states are reported here. Calculate a mean and a standard deviation for both groups for each variable and then describe the differences. Are males and females unequal on
Compute the standard deviation for the pretest and posttest scores that were used in problem 3.12. The scores are reproduced here. Taking into account all of the information you have on these variables, write a paragraph describing how the sample changed from test to test. What does the standard
Scores on a quiz were normally distributed and had a mean of 10 and a standard deviation of 3. For each of the following scores, find the Z score and the percentage of area above and below the score.
The average number of dropouts for a school district has been 305 per year, with a standard deviation of 50. What is the probability that next year the number of dropouts will bea. less than 250?________b. less than 300? ________c. more than 350? ________d. more than 400? ________e. between 250 and
To be accepted into an honor society, students must have GPAs in the top 10% of the school. If the mean GPA is 2.78 and the standard deviation is .33, which of the following GPAs would qualify?3.20, 3.21, 3.25, 3.30, 3.35
In a distribution of scores with a mean of 35 and a standard deviation of 4, which event is more likely: that a randomly selected score will be between 29 and 31 or that a randomly selected score will be between 40 and 42?
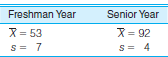
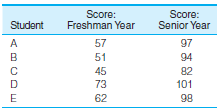
A large university administers entrance exams to all entering students. The test is administered again as an exit exam for all graduates. The test results forgone group of students are:a. The scores for five students on both tests are listed below. For each student, calculate Z scores and then
Assume that the distribution of a college entrance exam is normal, with a mean of 500 and a standard deviation of 100. For each of the following scores, find the equivalent Z score, the percentage of the area above the score, and the percentage of the area below the score.
A senior class has been given a comprehensive examination to assess educational experience. The mean on the test was 74 and the standard deviation was 10.What percentage of the students had scoresa. between 75 and 85?_________b. between 80 and 85? _________c. above 80? _________d. above 83?
For a normal distribution where the mean is 50 and the standard deviation is 10, what percentage of the area isa. between the scores of 40 and 47?________b. above a score of 47? ________c. below a score of 53? ________d. between the scores of 35 and 65? ________e. above a score of 72? ________f.
At St. Algebra College, the 200 freshmen enrolled in introductory biology took a final exam on which their mean score was 72 and the standard deviation was 6.The following table presents the grades of 10 students.Convert each into a Z score and determine the number of people who scored higher or
If a distribution of test scores is normal, with a mean of 78 and a standard deviation of 11, what percentage of the area liesa. below 60?_________b. below 70? _________c. below 80? _________d. below 90? _________e. between 60 and 65? _________f. between 65 and 79? _________g. between 70 and 95?
A scale measuring prejudice has been administered to a large sample of respondents. The distribution of scores is approximately normal, with a mean of 31 and a standard deviation of 5. What percentage of the sample had scoresa. below 20?________b. below 40? ________c. between 30 and 40? ________d.
For a math test on which the mean was 59 and the standard deviation was 4, what is the probability that a student randomly selected from this class will have a scorea. between 55 and 65?________b. between 60 and 65? ________c. above 65? ________d. between 60 and 50? ________e. between 55 and 50?
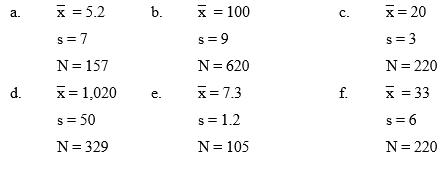
For each set of sample outcomes below, construct the 95% confidence interval for estimating m, the population mean.
A random sample of 1,496 respondents of a major metropolitan area was questioned about a number of issues. Construct estimates for the population at the 95% level for each of the results reported below. Express the final confidence interval in percentages (e.g., "between 40 and 45% agreed that
For the sample data below, construct four different interval estimates of the population mean-one each for the 90%, 95%, 99%, and 99.9% levels. What happens to the interval width as the confidence level increases? Why?X = 100s = 10N = 500
For each of the three sample sizes below, construct the 95% confidence interval. Use a sample proportion of 0.40 throughout. What happens to the interval width as the sample size increases? Why? Ps = 0.40 Sample A: N = 100 Sample B: N = 1,000 Sample C: N = 10,000
Two individuals are running for mayor of Shinbone, Kansas. You conduct an election survey a week before the election and find that 51% of the respondents prefer candidate A. Can you predict a winner? Use the 99% level. (In a two-candidate race, what percentage of the vote would the winner need?
The World Values Survey (www.worldvaluessurvey.org) is administered periodically to random samples from societies around the globe. Listed below are the number of respondents in each nation who said they are "very happy." Compute sample proportions and then construct confidence interval estimates
The fraternities and sororities at St. Algebra College have been plagued by declining membership over the past several years and want to know if the incoming freshman class will be a fertile recruiting ground. Not having enough money to survey all 1,600 freshmen, they commission you to survey the
For each set of sample outcomes below, construct the 99% confidence interval for estimating Pu.a. Ps = .14N = 100b. Ps = .37N = 522c. Ps = .79N = 121d. Ps = .43N = 1,049e. Ps = .40N= 548f. Ps = .63N = 300
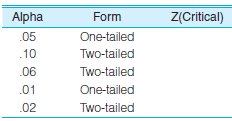
For each confidence level below, determine the corresponding Z score.
A researcher has gathered information from a random sample of 178 households. For each variable below, construct confidence intervals to estimate the population mean. Use the 90% level. a. An average of 2.3 people resides in each household. Standard deviation is .35. b. There was an average of 2.1
A random sample of 429 college students was interviewed about a number of matters. a. They reported that they had spent an average of $478.23 on textbooks during the previous semester. If the sample standard deviation for these data is $15.78, construct an estimate of the population mean at the 99%
The survey mentioned in problem 6.5 found that 25 of the 178 households consisted of unmarried couples who were living together. What is your estimate of the population proportion? Use the 95% level.
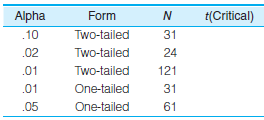
a. For each situation, find Z(critical).b. For each situation, find the critical t score.c. Compute the appropriate test statistic (Z or t) for each situation:1. μ = 2.40 = 2.20σ = 0.75 N = 2002. μ = 17.1 = 16.8σ = 0.9N = 453. μ = 10.2 = 9.4σ = 1.7N = 1504. Pu = .57 Ps =
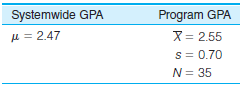
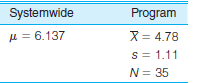
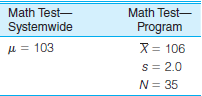
A school system has assigned several hundred €œchronic and severe€ underachievers to an alternative educational experience. To assess the program, a random sample of 35 students has been selected for comparison with all students in the system.a. In terms of GPA, did the program work?b. In
Statewide, the police clear by arrest 35% of the robberies and 42% of the aggravated assaults reported to them. A researcher takes a random sample of all the robberies (N = 207) and aggravated assaults (N = 178) reported to a metropolitan police department in one year and finds that 83 of the
A researcher has compiled a file of information on a random sample of 317 families that have chronic, long-term patterns of child abuse.Reported here are some of the characteristics of the sample, along with values for the city as a whole. For each trait, test the null hypothesis of "no
A researcher is studying changes in the student body at her university and has selected a random sample of 163 from the freshman class. The table below compares their characteristics to those of the student body as a whole. Which differences are significant?
What if the research question in problem 7.2 were changed to "Do seniors cut a significantly greater number of classes"? How would the test change? (This wording implies a one-tailed test of significance. How would the research hypothesis change? For the alpha you used in problem 7.2, what would
a. Nationally, the population as a whole watches 6.2 hours of TV per day. A random sample of 1,017 senior citizens report watching an average of 5.9 hours per day, with a standard deviation of 0.7. Is the difference significant? b. The same sample of senior citizens reports that they belong to an
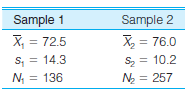
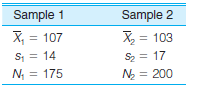
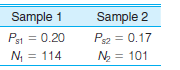
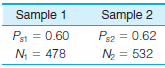
For each of the following, test for the significance of the difference in sample statistics by using the five step model. (Hint: Remember to solve Formula 8.4 before attempting to solve Formula 8.2. Also, in Formula 8.4, perform the mathematical operations in the proper sequence. First, square each
For each problem, test the sample statistics for the significance of the difference.a.b.
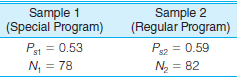
A large counseling center needs to evaluate several experimental programs. Write a paragraph summarizing the results of these tests. Did the new programs work?a. One program is designed for divorce counseling; the key feature of the program is its counselors, who are married couples working in
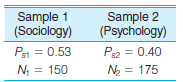
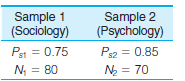
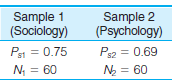
At St. Algebra College, the sociology and psychology departments have been feuding for years about the respective quality of their programs. In an attempt to resolve the dispute, you have gathered data about the graduate school experience of random samples of both groups of majors. The results are
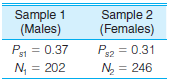
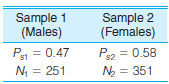
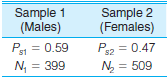
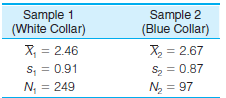
Some results from a survey administered to a nationally representative sample are reported here in terms of differences by sex. Which of these differences, if any, are significant? Write a sentence or two of interpretation for each test.a. Proportion favoring the legalization of marijuana:b.
Gessner and Healey administered questionnaires to samples of undergraduates. Among other things, the questionnaires contained a scale that measured attitudes toward interpersonal violence (higher scores indicate greater approval of interpersonal violence).Test the results as reported here for
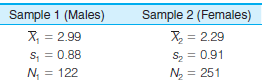
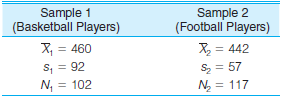
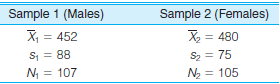
Do athletes in different sports vary in terms of intelligence? Reported here are College Board scores of random samples of college basketball and football players. Is there a significant difference? Write a sentence or two explaining the difference.a.b. What about male and female college athletes?
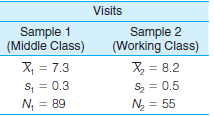
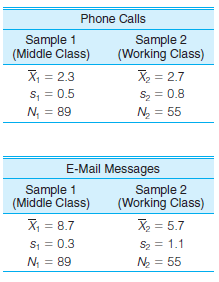
Are middle-class families more likely than working- class families to maintain contact with kin? Write a paragraph summarizing the results of these tests.a. A sample of middle-class families reported an average of 7.3 visits per year with close kin, while a sample of working-class families averaged
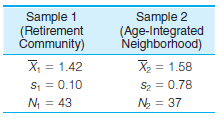
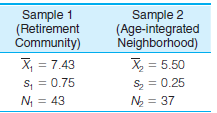
Are senior citizens who live in retirement communities more socially active than those who live in age-integrated communities? Write a sentence or two explaining the results of these tests. (Remember to use the proper formulas for small sample sizes.)a. A random sample of senior citizens living in
A survey has been administered to random samples of respondents in each of five nations. For each nation, are men and women significantly different in terms of their reported levels of satisfaction? Respondents were asked: "How satisfied are you with your life as a whole?" Responses varied from 1
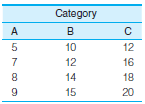
Conduct the ANOVA test for each of the following sets of scores. (Hint: Follow the computational shortcut outlined in the One Step at a Time Box on p. 229, and keep track of all sums and means by constructing computational tables like Table 9.3 or 9.4.)a.b.c.
A researcher is studying the effects of the college experience on attitudes, values, and behaviors and is comparing small random samples from each class at the same university. Which of the following differences are significant?a. Number of €œclose friends€ from another racial or ethnic
The Society for Ethical Culture provides non theistic services in a congregational setting. Until three years ago, the membership of the Persepolis New York Society grew steadily every year, but then it leveled off. The leaders have therefore decided to launch a membership drive, but before they
In a local community, a random sample of 18 couples has been assessed on a scale that measures the extent to which power and decision making are shared (lower scores) or monopolized by one party (higher scores) and marital happiness (higher scores indicate higher levels of happiness). The
Two separate afterschool programs for at risk teenagers have been implemented in the city of Redland. One is a big brother/big sister mentoring program in which adult volunteers are paired with troubled teenagers. The second involves extracurricular team sports competitions. In terms of the
Are sexually active teenagers any better informed about AIDS and other potential health problems related to sex than teenagers who are sexually inactive? A 15-item test of general knowledge about sex and health was administered to random samples of teens who are sexually inactive, teens who are
Does the rate of voter turnout vary significantly by the type of election? A random sample of voting precincts displays the following pattern of voter turnout by election type. Assess the results for significance.
Do older citizens lose interest in politics and current affairs? A brief quiz on recent headline stories was administered to random samples of respondents from each of four different age groups. Is there a significant difference? The following data represent the number of correct responses.
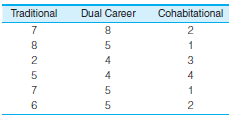
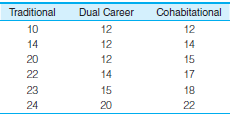
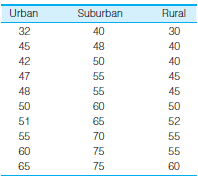
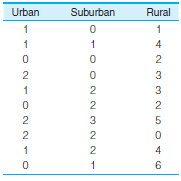
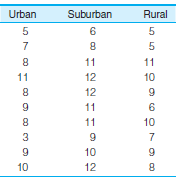
A small random sample of respondents has been selected from the General Social Survey database. Each respondent has been classified as either a city dweller, a suburbanite, or a rural dweller. Are there statistically significant differences by place of residence for any of the variables listed
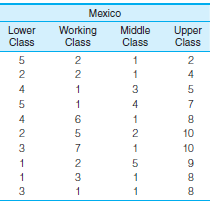
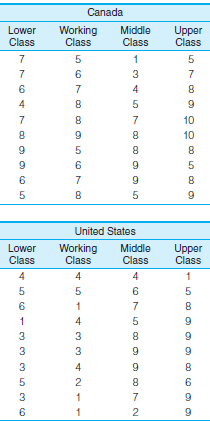
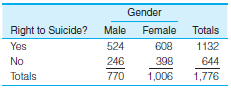
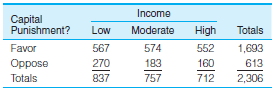
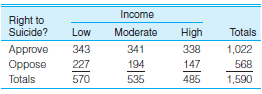
Does support for suicide (€œdeath with dignity€) vary by social class? Is this relationship different in different nations? Small samples in three nations were asked if it is ever justified for a person with an incurable disease to take his or her own life. Respondents answered in terms of a
For each of the following tables, calculate the obtained chi square. (Hint: Calculate the expected frequencies for each cell with Formula 10.2. Double- check to make sure you are using the correct row and column marginals for each cell. It may be helpful to record the expected frequencies in table
At a large urban college, about half the students live off campus in various arrangements and the other half live in dormitories on campus. Is academic performance dependent on living arrangements? The results based on a random sample of 300 students are presented here.a. Is there a statistically
Does support for the legalization of marijuana vary by region of the country? The table displays the relationship between the two variables for a random sample of 1,020 adult citizens. Is the relationship significant?a. Is there a statistically significant relationship between these variables?b.
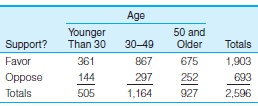
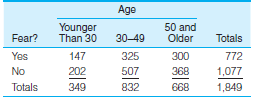
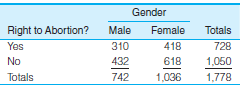
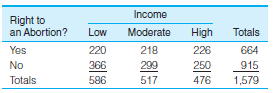
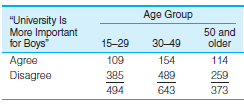
Some results from a survey administered to a nationally representative sample are presented here.For each table, conduct the chi square test of significance and compute column percentages. Write a sentence or two of interpretation for each test.a. Support for the legal right to an abortion by
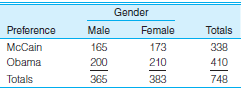
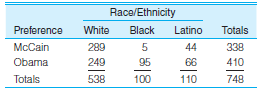
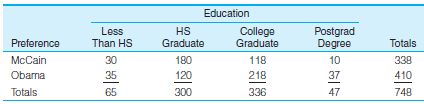
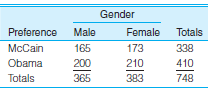
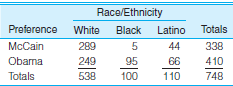
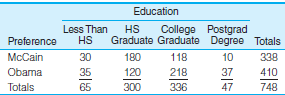
A random sample of 748 voters in a large city were asked how they voted in the presidential election of 2008. Calculate chi square and the column percentages for each table below and then write a brief report describing the significance of the relationships as well as the patterns you observe.a.
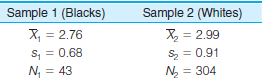
A local politician is concerned that a program for the homeless in her city is discriminating against blacks and other minorities. The following data were taken from a random sample of black and white homeless people.a. Is there a statistically significant relationship between race and whether the
Is there a relationship between salary levels and unionization for public employees? The following data represent this relationship for fire departments in a random sample of 100 cities of roughly the same size. Salary data have been dichotomizedat the median. Summarize your findings.a. Is there a
A state's Department of Education has rated a sample of local school systems for compliance with state-mandated guidelines for quality. Is the quality of a school system significantly related to the affluence of the community as measured by per capita income?a. Is there a statistically significant
Is there a relationship between length of marriage and satisfaction with marriage? The necessary information has been collected from a random sample of 100 respondents drawn from a local community. Write a sentence or two explaining your decision.a. Is there a statistically significant relationship
Various supervisors in the city government of Shinbone, Kansas, have been rated on the extent to which they practice authoritarian styles of leadership and decision making. The efficiency of each department has also been rated, and the results are summarized in the following table. Use column
Below are the tables you analyzed with chi square in problem 10.16. As you recall, these are the results of a survey of 748 voters in a large city concerning how they voted in the 2008 presidential election. Use column percentages, the maximum difference, and an appropriate measure of association
The administration of a local college campus has proposed an increase in the mandatory student fee in order to finance an upgrading of the intercollegiate football program. A survey sampling the opinions of the faculty regarding this proposal has been completed. Is there any association between
How consistent are people in their voting habits? Do people vote for the same party from election to election? Below are the results of a poll in which people were asked if they had voted Democrat or Republican in each of the last two presidential elections. Use column percentages, the maximum
A needs assessment survey has been distributed in a large corporation. Employees have been asked if they thought that a new policy of casual dress on Fridays would boost company morale. Use column percentages, the maximum difference, and measures of association to describe the strength and
As the state director of mental health programs, you note that some local mental health facilities have very high rates of staff turnover. You believe that part of this problem is a result of the fact that some of the local directors have very little training in administration and poorly developed
About half the neighborhoods in a large city have instituted programs to increase citizen involvement in crime prevention. Do these areas experience less crime? Write a few sentences describing the relationship in terms of pattern and strength of the association. Use column percentages, the maximum
A survey of senior citizens who live in either a housing development specifically designed for retirees or an age-integrated neighborhood has been conducted. Is the type of living arrangement related to the sense of social isolation?
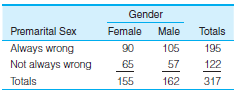
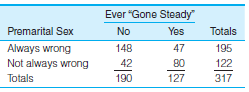
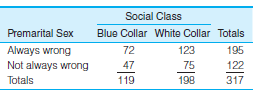
A researcher has given a survey on sexual attitudes to a sample of 317 teenagers. The respondents were asked whether they considered premarital sex to be €œalways wrong€ or €œnot always wrong.€ The tables below summarize the relationship between responses to this item and several
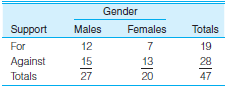
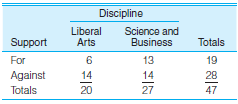
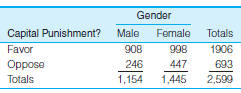
Below are five dependent variables cross tabulated against gender as an independent variable. Use column percentages, the maximum difference, and an appropriate measure of association to analyze these relationships. Summarize the results of your analysis in a paragraph that describes the
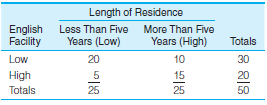
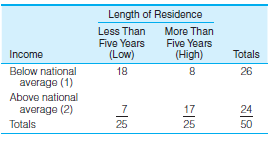
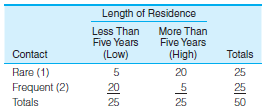
A small sample of non-English-speaking immigrants to the United States has been interviewed about their level of assimilation. Is the pattern of adjustment affected by length of residence in the United States? For each table, compute gamma and summarize the relationship in terms of strength and
In problem 11.9, we looked at the relationships between five dependent variables and sex. Now we will use income as an independent variable and assess its relationship with this same set of variables. For each table, calculate percentages and gamma. Describe the strength and direction of each
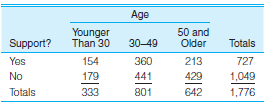
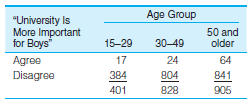
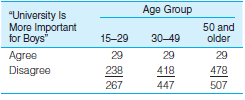
Is there a relationship between age and support for traditional gender roles? Is the relationship between the variables different for different nations? The World Values Survey has been administered to random samples drawn from Canada, the United States, and Mexico. Respondents were asked if they
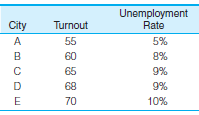
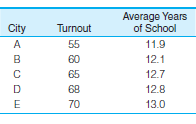
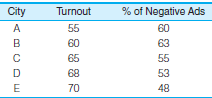
Why does voter turnout vary from election to election? For municipal elections in five different cities, information has been gathered on the percentage of registered voters who actually voted, unemployment rate, average years of education for the city, and the percentage of all political ads that
Occupational prestige scores for a sample of fathers and their oldest son and oldest daughter are presented below.Analyze the relationship between father's and son's prestige and the relationship between father's and daughter's prestige. For each relationship:a. Draw a scatter gram and a freehand
The residents of a housing development for senior citizens have completed a survey in which they indicated how physically active they are and how many visitors they receive each week. Are these two variables related for the 10 cases reported here?Draw a scatter gram and then compute r and r2. Find
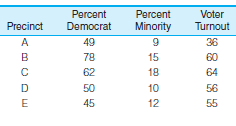
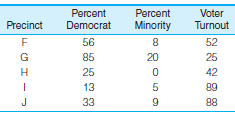
The following variables were collected for a random sample of 10 precincts during the last national election. Draw scatter grams and then compute r and r2for each combination of variables. Write a paragraph interpreting the relationship between these variables.
The table below presents the scores of 10 states on each of six variables, which are three measures of criminal activity as dependent variables and three possible independent variables: unemployment rate, education, and poverty. Crime rates are the number of incidents per 100,000 population.For
Showing 59500 - 59600
of 88243
First
589
590
591
592
593
594
595
596
597
598
599
600
601
602
603
Last
Step by Step Answers
.png)
.png)
.png)
.png)
.png)
.png)
.png)
.png)
.png)
.png)
.png)
.png)
.png)
.png)
.png)
.png)
.png)
.png)
.png)
.png)
.png)
.png)
.png)

.png)
.png)
.png)
.png)
.png)
.png)
.png)
.png)
.png)
.png)
.png)
.png)

.png)
.png)
.png)
.png)
.png)
.png)
.png)

