New Semester
Started
Get
50% OFF
Study Help!
--h --m --s
Claim Now
Question Answers
Textbooks
Find textbooks, questions and answers
Oops, something went wrong!
Change your search query and then try again
S
Books
FREE
Study Help
Expert Questions
Accounting
General Management
Mathematics
Finance
Organizational Behaviour
Law
Physics
Operating System
Management Leadership
Sociology
Programming
Marketing
Database
Computer Network
Economics
Textbooks Solutions
Accounting
Managerial Accounting
Management Leadership
Cost Accounting
Statistics
Business Law
Corporate Finance
Finance
Economics
Auditing
Tutors
Online Tutors
Find a Tutor
Hire a Tutor
Become a Tutor
AI Tutor
AI Study Planner
NEW
Sell Books
Search
Search
Sign In
Register
study help
business
business statistics communicating
Essential Statistics Exploring The World Through Data 2nd Global Edition Robert Gould, Colleen N. Ryan, Rebecca Wong - Solutions
4.7 Sisters and Brothers The scatterplot shows the numbers of brothers and sisters for a large number of students. Do you think the trend is somewhat positive or somewhat negative? What does the direction (positive or negative) of the trend mean? Does the direction make sense in this context?
4.6 Comparing Salaries The scatterplot shows the salary and year of first employment for some professors at a college. Explain, in context, what the negative trend shows. Who makes the most and who makes the least?(Source: Minitab, Student 12, “Salary.”) Salary (thousands of dollars per year)
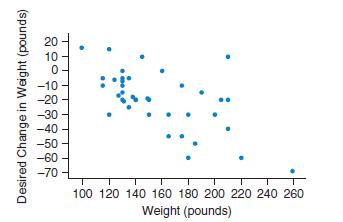
4.5 Weight Loss (Example 1) The scatterplot shows the actual weight and desired weight change of some students. Thus, if a student weighed 220 and wanted to weigh 190, the desired weight change would be negative 30.Explain what you see. In particular, what does it mean that the trend is negative?
4.4 Shoe Size and GPA The figure shows a scatterplot of shoe size and GPA for some college students. Does it show an increasing trend, a decreasing trend, or no trend? Is there a strong relationship? GPA 4.0 3.5 3.0- 2.5- 2.0- 5 6 7 8 9 10 11 12 Shoe Size
4.3 Car Value and Age of Student The scatterplot shows the age of students and the value of their cars according to the Kelley Blue Book. Does it show an increasing trend, a decreasing trend, or very little trend? Explain. Value of Car (dollars) 16000 14000- 12000 10000 8000 6000- 4000- 2000- 0 20
4.2 Predicting Total Value of Property Both scatterplots concern the total assessed value of properties that include homes, and both depict the same observations.a. Which do you think has a stronger relationship with value of the property—the number of square feet in the home (shown in part B of
4.1 Predicting Land Value Both scatterplots concern the assessed value of land (with homes on the land), and both depict the same observations.a. Which do you think has a stronger relationship with value of the land—the number of acres of land or the number of rooms in the homes? Why?b. If you
3.94 House Prices The figure, which is from data taken from the Ventura County Star, shows a histogram of house prices in Thousand Oaks, California, in 2009. The location of the mean and median are marked with letters. Which is the location of the mean, A or B? Explain why the mean and median are
3.93 Players’ Ages Here are the ages of some players in a team:22, 25, 27, 26, 29, 28, 24, 31, 34, 29, 30, 34, and 21. The coach’s age is 55 and should be included as one of the ages when you do the calculations below. The figure shows a histogram of the data.a. Describe the distribution of
3.92 Children’s Heights Mrs. Diaz has two children: a threeyear-old boy 43 inches tall and a ten-year-old girl 57 inches tall.Three-year-old boys have a mean height of 38 inches and a standard deviation of 2 inches, and ten-year-old girls have a mean height of 54.5 inches and a standard deviation
3.91 Salaries The monthly salaries of qualified professionals have a mean of $50,000 and a standard deviation of $20,000, while those of semi-qualified professionals have a mean of $29,000 and a standard deviation of $3,500. Assuming both types of salaries have distributions that are unimodal and
3.90 Girls’ Weights The weight-for-age for girls of 8 years is 26 kg with a standard deviation of 4.5 kg. How heavy is an 8-yearold girl with a z-score of 20.4? (Source: www.who.int)
3.89 Exam Scores An exam has a mean of 70 and a standard deviation of 10. What exam score corresponds to a z-score of 1.5?
3.88 Driving Accidents College student Sandy Hudson asked a group of college students the total number of traffic accidents they had been in as drivers. The histograms are shown, and the table displays some descriptive statistics.a. Refer to the histograms. If we wish to compare the typical numbers
3.87 Study Hours A group of 50 statistics students, 25 men and 25 women, reported the number of hours per week spent studying statistics.a. Refer to the histograms. Which measure of the center should be compared:the means or the medians? Why?b. Compare the distributions in context using appropriate
3.86 Eating Out, Again College student Jacqueline Loya asked 50 employed students how many times they went out to eat last week.Half of the students had full-time jobs and half had part-time jobs.Full-time: 5, 3, 4, 4, 4, 2, 1, 5, 6, 5, 6, 3, 3, 2, 4, 5, 2, 3, 7, 5, 5, 1, 4, 6, 7 Part-time: 1, 1,
3.85 Surfing, Again College students and surfers Rex Robinson and Sandy Hudson collected data on the self-reported numbers of days surfed in a month for 30 longboard surfers and 30 shortboard surfers.Longboard: 4, 9, 8, 4, 8, 8, 7, 9, 6, 7, 10, 12, 12, 10, 14, 12, 15, 13, 10, 11, 19, 19, 14, 11,
3.84 Population Increase Data were recorded for each of the Egyptian districts: the district, its population in 1996, its population in 2006, and the governorate in which it is located (Markaz, Kism, New City, etc.). Find the population increase percentage for each state by applying the following
3.83 Population Density Data were recorded for each of the Egyptian districts: the district, its population (in 2006), its area (in square miles), and the governorate in which it is located (Markaz, Kism, New city, etc.). For each state, find the population density:the number of people divided by
3.82 The standard deviation of set A is larger, but the interquartile range of set B is larger. Report both standard deviations and interquartile ranges.
3.81 The mean of set A is larger than that of set B, but the median of set B is larger than the median of set A. Label each dotplot with its mean and median in the correct place.
3.80 The means are different, but the standard deviations are the same. Report both means and the standard deviation.
3.79 The means are the same, but the standard deviation of one of the sets is larger than that of the other. Report the mean and both standard deviations.
3.78 Ideal Family In 2012, the General Social Survey asked respondents how many children they felt would be in an “ideal”family. The histogram contains the data from 1730 people who responded to the survey.a. Approximately what is the mean ideal number of children? Explain how you chose this
3.77 Heightsa. State an approximate value for the mean height by looking at the graph.b. Here is a proposed method for finding an approximation for the standard deviation based on the histogram: Find the approximate range and divide by 6. This method comes from the idea that nearly all the data
3.76 Holiday Spending A StatCrunch survey asked people how much money they spent for gifts during the holidays. Compare the males and females, using both graphical and numerical summaries.Calculate the numbers from the data at this text’s website.
3.75 Soda Consumption A StatCrunch survey asked people about their consumption of soda as a percentage of liquid intake.The data for 130 males and 130 females can be found at this text’s website. Compare the two groups with histograms and appropriate measures of center and spread. (Source:
3.74 Marathon Times The histogram of marathon times includes data for men and women and also for both an Olympic marathon and an amateur marathon. Greater values indicate slower runners.(Sources: www.forestcityroadraces.com and www.runnersworld.com)a. Describe the shape of the distribution.b. What
3.73 Heights The graph shows the heights for a large group of adults. Describe the distribution, and explain what might cause this shape. (Source: www.amstat.org) Frequency 80 70 60 50 40 30 20 10 0 56 58 60 62 64 66 68 70 72 74 76 78 Height (inches)
3.72 Speeding Tickets College students Diane Glover and Esmeralda Olguin asked 25 men and 25 women how many speeding tickets they had received in the last three years.Men: 14 men said they had 0 tickets, 9 said they had 1 ticket, 1 had 2 tickets, and 1 had 5 tickets.Women: 18 said they had 0
3.71 Final Exam Grades The data that follow are final exam grades for two sections of statistics students at a community college.One class met twice a week relatively late in the day; the other class met four times a week at 11 a.m. Both classes had the same instructor and covered the same content.
3.70 Heights of Sons and Dads The data at this text’s website give the heights of 18 male college students and their fathers, in inches.a. Make histograms and describe the shapes of the two data sets from the histograms.b. Fill in the following table to compare descriptive statistics.c. Compare
3.69 Head Circumference (Example 16) Following are head circumferences, in centimeters, for some men and women in a statistics class.Men: 58, 60, 62.5, 63, 59.5, 59, 60, 57, 55 Women: 63, 55, 54.5, 53.5, 53, 58.5, 56, 54.5, 55, 56, 56, 54, 56, 53, 51 Compare the circumferences of the men’s and
3.68 Death Row: West The table shows the numbers of capital prisoners (prisoners on death row) in 2013 in the western U.S.states. (Source: deathpenaltyinfo.org)State CapPris Alaska 0 Arizona 127 California 727 Colorado 4 Hawaii 0 Idaho 13 Montana 2 State CapPris Nevada 79 New Mexico 2 Oregon 37
3.67 Death Row: South (Example 15) The table shows the numbers of capital prisoners (prisoners on death row) in 2013 in the southern U.S. states. (Source: http://www.deathpenaltyinfo.org)a. Find the median number of prisoners and interpret (using a sentence in context).b. Find the interquartile
3.66 Exam Scores The five-number summary for a distribution of final exam scores is 60, 78, 80, 90, 100 Is it possible to draw a boxplot based on this information? Why or why not?
3.65 Exam Scores The five-number summary for a distribution of final exam scores is 40, 78, 80, 90, 100 Explain why it is not possible to draw a boxplot based on this information.(Hint: What more do you need to know?)
3.64 Passing the Bar Exam The dotplot shows the distribution of passing rates for the bar exam at 185 law schools in the United States in 2009.The five number summary is 26, 80, 86, 90, 100Draw the boxplot and explain how you determined where the whiskers go. 20 40 60 08 80 100 Bar-Passing
3.63 Tall Buildings The dotplot shows the distribution of the world’s tallest buildings with respect to their height, in feet. The five-number summary is 745 ft, 810 ft, 883 ft, 1093 ft, 2717 ftDraw a boxplot. Describe the shape of the distribution. T 0 500 1000 1500 2000 2500 3000 Height (feet)
3.62 BA Percentage The data show the percentage of residents with bachelor’s degrees in the 50 states and Washington, DC. Make a boxplot of the data. You may either make a boxplot with technology using the data at this text’s website or sketch the boxplot using the descriptive statistics below.
3.61 Sleep Time of Animals Data at this text’s website show the average amount of time animals sleep per day (in hours). The number listed for humans is 8 hours. You may either make a boxplot with technology using the data at this text’s website or make a sketch of the boxplot from the
3.60 Matching Boxplots and Histograms Match each of the histograms (X, Y, and Z) with the corresponding boxplot (C, M, or P).Explain your reasoning. Frequency C M P 2 4 2 4 6 8 10 12 14 16 18 0 3 6 9 12 15 18 Y
3.59 Matching Boxplots and Histogramsa. Report the shape of each histogram.b. Match each histogram with the corresponding boxplot (A, B, or C). 20 Histogram 1 15 Frequency T 10 10 5 0 Histogram 2 10 8 Frequency so 4 2 0
3.58 Brain Size The boxplots show the brain size (in hundreds of thousands of pixels) for 20 men and 20 women. Estimate the numerical values of the medians by using the boxplots. Do these men, or do these women, have greater variation in brain size? Why? (Source:Willerman, L., Schultz, R.,
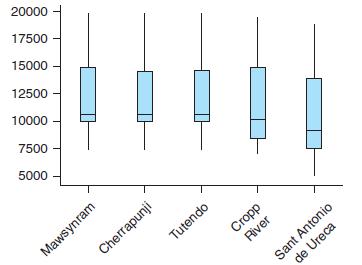
3.57 Rainfall The boxplot shows rainfall for the five rainiest places in the world. Each place’s boxplot was made from 12 rainfall records:the average monthly rainfall over a period of years. Which place tends to be the wettest? Which place has the most variation in rainfall?Compare the rainfall
3.56 Health Insurance Rates The boxplot shows the rate of persons per 100,000 who are not covered by health insurance in different countries of the Middle East. The persons are categorized as Married(M), Widowed (W), Divorced (D), Separated (S), and Never Married(NM). (Source: 2015 World Almanac
3.55╇ Departmental Disparity╇ The figure shows the salary for 60 employees of an organization. The organization is divided into four departments—Production (P), Administration (AD), Sales (S), and Accounts (A). In the Administration department, the potential outlier is CEO, and in
3.54╇ Tax Rates╇ A StatCrunch survey asked people what maximum income tax rate (as a percentage of income) should be allowed and whether they were Republican or Democrat. Compare the two political parties. Compare shapes and appropriate measures of the center and spread. 30 30 20 20
3.53 Shoes (Example 14) The histograms show the number of pairs of shoes reported for 300 males and for 300 females.Descriptive statistics are also shown. (Source: StatCrunch Responses to Shoe Survey. Owner: scsurvey)a. Describe the shape of each histogram.b. Because of the shapes, what measures of
3.52 House Prices The graphs show the house prices (in hundreds of thousands of dollars) in two fictitious towns.a. If you were describing the prices in Town A in terms of shape, center, and spread, without comparing them to the prices in Town B, would you use the mean and standard deviation or the
3.51 Heads The graphs show the circumferences of heads for a group of men and a group of women.a. If you were describing the men’s heads in terms of shape, center, and spread, without comparing them to the women’s heads, would you use the mean and standard deviation or the median and
3.50 Factory Strike In 2010, the laborers of a major factory in Australia went on strike. At that time, the average salary of a laborer was AU$ 21.60 per hour, and the median salary was AU$20.00. If you were representing the owners, which summary would you use to convince the public that a strike
3.49 Mistake A teacher recorded the test score of a student in five different subjects. The maximum score for each subject is 50.As you can see, a mistake was made in recording one entry.25, 30, 41, 45, 280 When the mistake was corrected by removing the extra 0, will the median scores change? Will
3.48 Center and Variation When you are comparing two sets of data, and one set is strongly skewed and the other is symmetric, which measures of the center and variation should you choose for the comparison?
3.47 Outliersa. In your own words, describe to someone who knows only a little statistics how to recognize when an observation is an outlier. What action(s) should be taken with an outlier?b. Which measure of the center (mean or median) is more resistant to outliers, and what does “resistant to
3.46╇ Nutrition The rate of malnutrition is given for urban areas of 45 countries and rural areas of 30 countries. (Source: www.unicef.org)a. Compare the median rates of malnutrition for urban and rural areas.b. Compare the interquartile ranges of the rates of malnutrition for urban and
3.45╇ Happiness (Example 13) Use the data in Exercise 3.24 on the happiness of men and women.a. Compare the median happiness level for the men to that for the women by copying the sentence below and filling in the blanks.The median for the men was _________ and the median for the women was
3.44╇ Best-selling Books Find the median and interquartile range of the top seven bestsellers; refer to Exercise 3.42 for the data.
3.43╇ Pixar Animated Movies Again (Example 12) Find the median and interquartile range of the top seven Pixar animated movies; refer to Exercise 3.41 for the data.
3.42╇ Best-selling Books The numbers of copies sold (inÂ�millions) for the top ten best-selling books in 2015–2016 are shown in the table. (Source: www.top101news.com)Book Copies (in millions)A Tale of two Cities 200 Lord of the Rings 150 Le Petit Prince 140 Harry Potter and the
3.41╇ Pixar Animated Movies (Example 11) The ten top-grossing Pixar animated movies for the U.S. box office up to June 2013 are shown in the table on the next page, in millions of dollars. (Source: www.pixar.com)a. Sort the gross income from smallest (on the left) to largest, and write down
3.40╇ Name two measures of the variation of a distribution, and state the conditions under which each measure is preferred for�measuring the variability of a single data set.
3.39╇ Name two measures of the center of a distribution, and state the conditions under which each is preferred for describing the�typical value of a single data set.
3.38╇ Leaves╇ The number of leaves taken per year by employees of an office has a mean of 50 and a standard deviation of 5.a. What number of leaves corresponds to a z-score of 1.25?b. What number of leaves corresponds to a z-score of -1.75?
3.37╇ Men’s Shoe Sizes╇ Assume that men’s shoe sizes have a mean of 7 and a standard deviation of 1.5.a. What men’s shoe size corresponds to a z-score of 1.00?b. What men’s shoe size corresponds to a z-score of -1.50?
3.36╇ Birth Lengths╇ Babies born after 40 weeks gestation have a mean length of 52.2 centimeters (about 20.6 inches). Babies born one month early have a mean length of 47.4 cm. Assume both standard deviations are 2.5 cm and the distributions are unimodal and symmetric. (Source:
3.35╇ Low-Birth-Weight Babies (Example 10)╇ Babies born weighing 2500 grams (about 5.5 pounds) or less are called�low-birth-weight babies, and this condition sometimes indicates health problems for the infant. The mean birth weight for U.S.-born children is about 3462 grams (about
3.34╇ Flight Arrivals╇ Distributions of delays in flight arrival of a particular airline are roughly bell-shaped. The mean delay in arrival time is 12 minutes, and the standard deviation is 4 minutes. Which is more usual, a flight arriving 4 minutes earlier than the mean delay time or
3.33╇ Unusual Strike (Example 9)╇ A batsman has a strike rate of 180 and a standard deviation of 12. Which is more unusual, a strike rate of 192 or a strike rate of 156?
3.32╇ Heights╇ Refer to the dotplot in the previous question.a. What is the height of a woman with a z-score of -1?b. What is the z-score for a woman who is 70 inches tall (5 feet 10 inches)?
3.31╇ Heights and z-Scores╇ The dotplot shows heights of�college women; the mean is 64 inches (5 feet 4 inches), and the standard deviation is 3 inches.a. What is the z-score for a height of 58 inches (4 feet 10 inches)?b. What is the height of a woman with a z-score of 1? 55 58
3.30╇ Burglary╇ In 2014, the mean burglary rate (per 1000 houses)for all cities in a state was 250; the standard deviation was 25.Assume the distribution of burglary rates is approximately unimodal and symmetric.a. Approximately what percentage of cities would you expect to have
3.29╇ Burglary (Example 8)╇ In 2014, the mean burglary rate�(per 1000 houses) for all states in a country was 978; the standard deviation was 32. Assume the distribution of burglary rates is approximately unimodal and symmetric.a. Approximately what percentage of states would you
3.28 Violent Crime: East In 2011, the mean rate of violent crime (per 100,000 people) for the 10 northeastern states was 314, and the standard deviation was 118. Assume the distribution of violent crime rates is approximately unimodal and symmetric.a. Between what two values would you expect to
3.27 Violent Crime: West (Example 7) In 2011, the mean rate of violent crime (per 100,000 people) for the 24 states west of the Mississippi River was 406. The standard deviation was 177.Assume that the distribution of violent crime rates is approximately unimodal and symmetric. See page 158 for
3.26 Professors’ Salaries The annual salaries (in Great Britain pounds [GBP]) of 22 professors and 35 assistant professors working in various institutes across the world (for 2012–2013) are given. (Source: Professor Median Salary by Disciplines, Level, and Institution, 2012–2013, accessed via
3.25 Nutrition The percentage of malnutrition prevailing in children is given for urban and rural areas. The data are at this text’s website.(Source: www.unicef.org)a. Compare the mean percentage of malnutrition.b. Compare the standard deviation of the percentage of malnutrition in children from
3.24 Happiness A survey on StatCrunch asked people to report their level of happiness from 1 (least happy) to 100 (most happy).The table shows a sample of 20 female and 20 male responses.(Source: StatCrunch Responses to Happiness survey. Owner:Webster West)a. Make two separate stemplots (or
3.23 Brain Size The brain size (in hundreds of thousands of pixels)is reported for some men and women in the table. (Source:Willerman, L., Schultz, R., Rutledge, J. N., and Bigler, E. (1991),“In Vivo Brain Size and Intelligence,” Intelligence, 15, 223–228.)a. Make two separate stemplots (or
3.22 IQ Suppose you have a data set with IQ levels of some students who perform well in quizzes and some students who are excellent athletes. Which group of students do you think would have a higher standard deviation of IQ levels? Explain.
3.21 Cricket In the recent cricket matches, do you think the standard deviation of the average runs scored by all players in a T-20 match would be larger or smaller than the standard deviation of the average runs scored by all players in a test match? Explain.
3.20 Pocket Money A father pays pocket money to his daughter on different days as 10, 4, 15, and 12 U.S. dollars (USD). In cents (1 USD 5 100 cents), these pocket money values are 1000, 400, 1500, and 1200.a. Compare the mean in USD with the mean in cents; do not forget the units. Explain what
3.19 Ages (Example 6) A father has five children of ages 2, 3, 5, 8, and 9 years.a. Calculate the standard deviation of their current ages.b. Without doing any calculation, indicate whether the standard deviation of the children’s ages in the next 15 years will be larger, smaller, or the same as
3.18 Birth Length The mean birth length for U.S. children born at full term (after 40 weeks) is 52.2 cm (about 20.6 inches).Suppose the standard deviation is 2.5 cm and the distributions are unimodal and symmetric. (Source: www.babycenter.com)a. What is the range of birth lengths (in centimeters)
3.17 Birth Weights (Example 5) The mean birth weight for U.S. children born at full term (after 40 weeks) is 3462 grams(about 7.6 pounds). Suppose the standard deviation is 500 grams and the shape of the distribution is symmetric and unimodal.(Source: www.babycenter.com)a. What is the range of
3.16 Suits of cards The histograms contain data with a range of 1 to 4. Which group would have the larger standard deviation, group A or group B? Why? T (A) Relative Frequency 0.4 0.35 0.3 0.25 0.2 0.15 0.1 0.05 0 T T (B) Relative Frequency 0.4 0.35 0.3 0.25 0.2 3 Suits on Deck 1 1 2 0.15 0.1 0.05
3.15 Inflation Rates (Example 4) Look at the two histograms, created from the data taken from data.worldbank.org, and decide whether you think the standard deviation of inflation rates in Australia (A) was larger or smaller than the standard deviation of inflation rates in New Zealand (B). Explain.
3.14 Working Overtime A statistician asked a group of 60 employees how many hours they have worked overtime during the last two weeks. Half of the employees are white-collar workers and half are blue-collar workers White@collar employees: 20, 10, 13, 10, 11, 12, 10, 15, 8, 5, 7, 9, 8, 6, 4, 20, 15,
3.13 Attendance The teachers of a school collected data on the self-reported numbers of sick leaves taken by students in the months of September and October.September: 8, 3, 2, 1, 6, 4, 1, 8, 2, 2, 2, 5, 7, 1, 8, 9, 4, 3, 2, 6, 8, 1, 3, 9, 8, 1, 1, 12, 9, 10 October: 2, 8, 3, 6, 1, 5, 4, 9, 8, 1,
3.12 Education of Fathers and Mothers The table shows Minitab descriptive statistics for the years of education for the fathers and mothers of students in one of the author’s statistics classes and in one of her pre-algebra classes. Twelve years is equivalent to a high school education.a. Are the
3.11 Weight Loss (Example 3) The table shows Minitab descriptive statistics for the weight of some women (weight_f)and men (weight_m), and the self-reported ideal weights for both.a. Subtract the women’s mean weight from their mean ideal weight to find the mean desired weight change. Did the
3.10 Military Coup The tenure of military coups in Argentina has been 2, 3, 3, 1, 7 and 7 years. (Source: Wikipedia)a. Find and interpret (report in context) the mean time of the coups, rounding to the nearest tenth. The mean time of the military coups in another South American country was 1.3
3.9 Best-Performing Cars In 2013, 66 international motoring journalists selected the 10 best-performing cars of the previous 12 months. The brake horsepowers of the top five cars were 730, 565, 571, 197 and 320. (Source: The Telegraph)a. Find the mean power, rounding to the nearest tenth. The mean
3.8 Age of Prime Ministers This list represents the ages of the first six prime ministers of India when they first assumed office.(Source: www.pmindia.gov.in)Pandit Jawahar Lal Nehru 58 Gulzari Lal Nanda 66 Lal Bahadur Shastri 63 Indira Gandhi 49 Morarji Desai 81 Charan Singh 72a. Find the mean
3.7 Paid Vacation Days (Example 2) This list represents the numbers of paid vacation days required by law for different countries. (Source: 2009 World Almanac and Book of Facts)United States 0 Australia 20 Italy 20 France 30 Germany 24 Canada 10a. Find the mean, rounding to the nearest tenth of a
3.6╇ Literacy╇ According to indexmundi.com, the rates of literacy in five countries in Oceania with the lowest rates of literacy are given in the table.Papua New Guinea 62 Vanuatu 83 Solomon Islands 84 Palau 92 Fiji 94
3.5╇ Literacy╇ According to indexmundi.com, the rates of literacy in five countries in the Middle East with the lowest rates of literacy are given in the table.Afghanistan 28 Pakistan 55 Yemen 65 Iraq 79 Syria 84a. Find and report the mean rate of literacy per country in context:The
3.4╇ Televisions╇ The histogram shows the number of televisions in the homes of 90 community college students. Judging from the histogram, what is the approximate mean number of televisions in the homes in this collection? Explain. 30 25 20 15 10 Frequency 5 0 0 2 4 6 8 Number of TVs
3.3╇ Age of CEOs (Example 1)╇ The histogram shows the ages of 25 CEOs listed at Forbes.com. Based on the distribution, what is the approximate mean age of the CEOs in this data set? Write a sentence in context (using words in the question) interpreting the estimated mean. The typical
3.2╇ Offices╇ An expert claims that all things being equal, offices without a reception area tend to sell for less than those with a reception area. What does this statement mean? (Pick the best choice.)a. There are more offices with a reception area than without.b. There is more
Showing 500 - 600
of 6020
1
2
3
4
5
6
7
8
9
10
11
12
13
14
15
Last
Step by Step Answers