New Semester
Started
Get
50% OFF
Study Help!
--h --m --s
Claim Now
Question Answers
Textbooks
Find textbooks, questions and answers
Oops, something went wrong!
Change your search query and then try again
S
Books
FREE
Study Help
Expert Questions
Accounting
General Management
Mathematics
Finance
Organizational Behaviour
Law
Physics
Operating System
Management Leadership
Sociology
Programming
Marketing
Database
Computer Network
Economics
Textbooks Solutions
Accounting
Managerial Accounting
Management Leadership
Cost Accounting
Statistics
Business Law
Corporate Finance
Finance
Economics
Auditing
Tutors
Online Tutors
Find a Tutor
Hire a Tutor
Become a Tutor
AI Tutor
AI Study Planner
NEW
Sell Books
Search
Search
Sign In
Register
study help
business
business statistics
Statistics 13th Global Edition James T. McClave And Terry T Sincich - Solutions
Use the applet entitled Hypotheses Test for a Proportion to investigate the relationships between the probabilities of Type I and Type II errors occurring at levels .05 and .01. For this exercise, use n = 100, true p = 0.5, and alternative not equal.a. Set null p = .5. What happens to the
Use the applet entitled Hypotheses Test for a Proportion to investigate the effect of the true population proportion p on the probability LO9 of a Type I error occurring. For this exercise, use n = 100 and alternative not equal.a. Set true p = .5 and null p = .5. Run the applet several times, and
Refer to Exercise 6.5.a. Show that x is an unbiased estimator of m.b. Find s 2x.c. Find the probability that the x will fall within 2sxm LO6
Refer to Exercise 6.7, in which we found the sampling distribution of the sample median. Is the median an unbiased LO6 estimator of the population mean m?
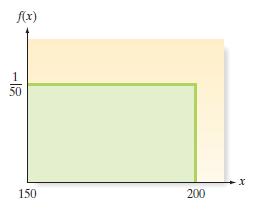
Suppose a population has the uniform probability distribution given in Figure 6.8. Then the mean and standard deviation of this probability distribution are, respectively, m = 175 and s = 14.43. (See Section 5.2 for the formulas for m and s.) Now suppose a sample of 11 measurements is selected from
A manufacturer of automobile batteries claims that the distribution of the lengths of life of its best battery has a mean of 54 months and a standard deviation of 6 months. Suppose a consumer group decides to check the claim by purchasing a sample LO6 of 50 of the batteries and subjecting them to
What do the symbols mx and sx represent? LO6
How does the mean of the sampling distribution of x relate to LO6 the mean of the population from which the sample is selected?
How does the standard deviation of the sampling distribution of x relate to the standard deviation of the population LO6 from which the sample is selected?
Another name given to the standard deviation of x is the ____________. (Fill in the blank.) LO6
State the Central Limit Theorem. LO6
Will the sampling distribution of x always be approximately normally distributed? Explain. LO6
Suppose a random sample of n measurements is selected from a population with mean m = 225 and variance s2= 225. For each of the following values of n, give the LO6 mean and standard deviation of the sampling distribution of the sample mean x.a. n = 9b. n = 49c. n = 225d. n = 500e. n = 1,000f. n =
Suppose a random sample of n = 16 measurements is selected from a population with mean m and standard deviation s. For each of the following values of m and s, give the values of mx and sx. LO6a. m = 12, s = 3b. m = 144, s = 16c. m = 24, s = 28d. m = 12, s = 96
Consider the following probability distribution:x 3 4 6 9 p1x2 .3 .1 .5 .1a. Find m, s2, and s.b. Find the sampling distribution of x for random samples of n = 2 measurements from this distribution by listing LO6 all possible values of x, and find the probability associated with each.c. Use the
A random sample of n = 100 observations is selected from a population with m = 31 and s = 25.a. Find mx and sx. LO6b. Describe the shape of the sampling distribution of x.c. Find P1x Ú 282.d. Find P122.1 … x … 26.82.e. Find P1x … 28.22.f. Find P1x Ú 27.02.
Open the applet entitled Sampling Distribution. On the pulldown menu to the right of the top graph, select Binary.a. Run the applet for the sample size n = 10 and the LO6 number of samples N = 1000. Observe the shape of the graph of the sample proportions, and record the mean, median, and standard
Open the applet entitled Sampling Distributions. On the pulldown menu to the right of the top graph, select Uniform. The box to the left of the top graph displays the population mean, median, and standard deviation of the original distribution. LO6a. Run the applet for the sample size n = 30 and
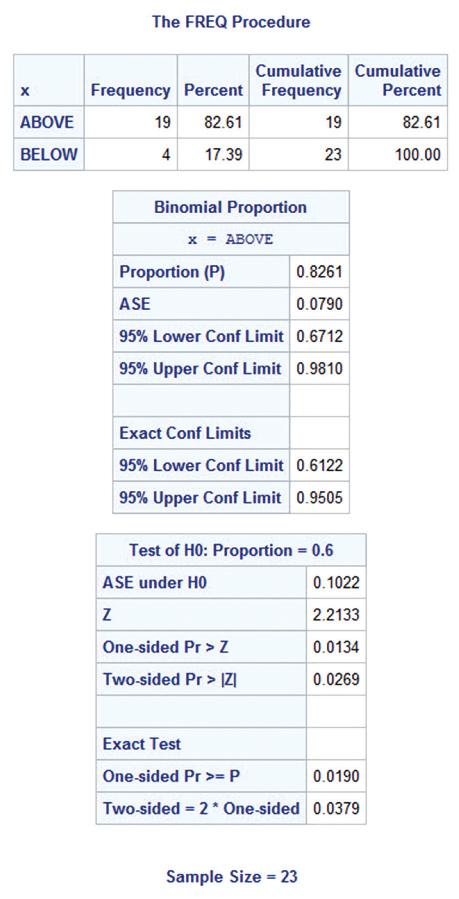
Defensibility of a landscape. Settlers often chose sites to live and build communities in based on the landscape’s defensibility.The defensibility of archaeological sites in the Northwest Pacific was investigated in the Journal of Anthropological LO9 Archaeology (Vol. 35, 2014). A defensibility
Recall the drug experiment in Examples 8.3 and 8.5, in which we tested to determine whether the mean response time for rats injected with a drug differs from the control mean response time of m = 1.2 seconds. The test setup is repeated here:H0: m = 1.2 Ha: m 1.2 1i.e., m 6 1.2 or m 7 1.22 LO9
How is the power of the test related to the acceptance region? LO9
If the power of the test tends to unity, then what will be the LO9 conclusion for the given testing problem?
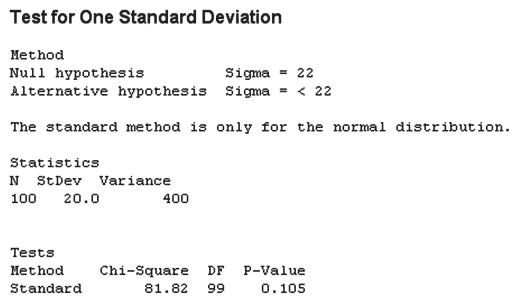
Refer to the fill weights for the sample of ten 16-ounce cans in Table 8.6. Is there sufficient evidence to conclude that the true standard deviation s of the fill LO9 measurements of 16-ounce cans is less than .1 ounce?
Refer to Example 4.13 (p. 236) and the problem of sampling city voters to LO6 determine whether they are in favor of a certain candidate for mayor. We assumed that 60% of all the city’s voters favor the candidate. Suppose we will randomly sample 100 voters and ask each if he or she is or is not
Refer to Example 8.13. Now conduct the two-tailed test of hypothesis, H0: s2= .01 against Ha: s2 .01, using a = .05. LO9
What test statistic is used to make inferences about s2?8.109 What assumption is required for a valid test for s2? LO9
True or False. The null hypotheses H0: s2 LO9= .36 and H0: s = .6 are equivalent.
True or False. Even when the sample size n is large, assumptions about the population are necessary to test the LO9 population variance s2.
Refer to Example 6.10 (p. 332). Again, assume that 60% of all city voters are in favor of the candidate. In a random sample of 100 voters, what is the probability that fewer than half are in favor of the candidate? LO6
Let x0 2 be a particular value of x2. Find the value of x0 2 such thata. P1x2 7 x0 2 2 = .05 for n = 12b. P1x2 7 x0 2 2 = .10 for n = 9 LO9c. P1x2 7 x0 2 2 = .05 for n = 5d. P1x2 6 x0 2 2 = .025 for n = 7e. P1x2 6 x0 2 2 = .10 for n = 10
A random sample of n = 2,000 measurements is drawn LO6 from a binomial population with probability of success .25.What are the smallest and largest values of pn you would expect to see?
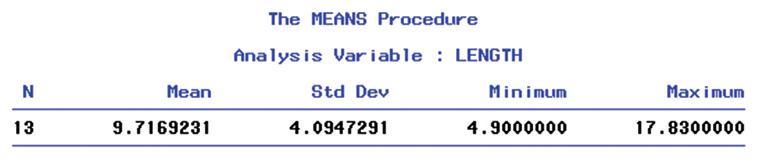
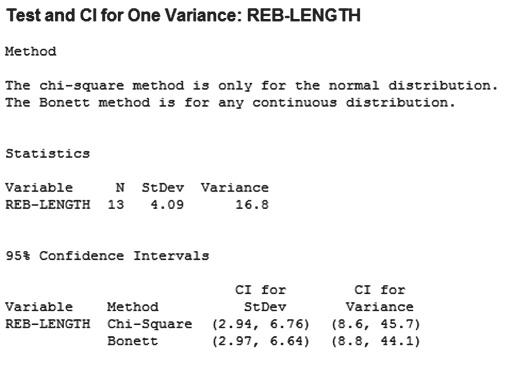
Characteristics of a rockfall. Refer to the Environmental Geology (Vol. 58, 2009) simulation study of how far a block from a collapsing rockwall will bounce down a soil slope, Exercise 2.61 (p. 89). Rebound lengths (in meters) were estimated for 13 rock bounces. The data are repeated in the table.
Shaft graves in ancient Greece. Refer to the American Journal of Archaeology (Jan. 2014) study of sword shaft graves in ancient Greece, Exercise 2.37 (p. 78). The number of sword shafts buried at each of 13 recently discovered grave sites is reproduced in the following table. Let s represent the
Strand bond performance of pre-stressed concrete. An experiment was carried out to investigate the strength of pre-stressed, bonded concrete after anchorage failure has occurred and the results published in Engineering Structures (June 2013). The maximum strand force, measured in kiloNewtons (kN),
True or False. The sample mean, x, will always be equal to mx. LO6
True or False. The sampling distribution of x is normally distributed, regardless of the size of the sample n. LO6
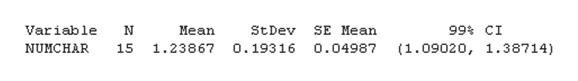
Drug content assessment. Analytical Chemistry (Dec. 15, 2009) presented research on a new method used by GlaxoSmithKline Medicines Research Center to determine the amount of drug in a tablet. Drug concentrations(measured as a percentage) for 50 randomly selected tablets are provided in the
True or False. The standard error of x will always be smaller than s. LO6
Describe how you could obtain the simulated sampling distribution of a sample statistic. LO6
True or False. The sampling distribution of pn is normally distributed for large n LO6
A random sample of n = 64 observations is selected from a population with m = 22.5 and s = 2.8. Approximate each of the following probabilities:a. P1x … 22.52 LO6b. P1x … 222c. P1x Ú 23.52d. P121.9 … x … 22.82
What is the p-value associated with a test of hypothesis in LO9 statistics?
A random sample of n = 300 observations is selected from a binomial population with p = .8. Approximate each of the following probabilities:a. P1pn 6 .662 LO6b. P1pn 7 .552c. P1.58 6 pn 6 .622
What is the criterion of the parent population for a LO9 large-sample and small-sample test of hypothesis about a population variance s2.
What is the critical value of the test? LO9
If the acceptance of the alternative hypothesis of a particular test would cause your firm to go out of business, would you want a to be small or large? Explain. LO9
Complete the following statement: The larger the LO9 p-value associated with a test of hypothesis, the weaker is the support for the ____ hypothesis. Explain your answer.
Masculinizing human faces. Nature (Aug. 27, 1998) published a study of facial characteristics that are deemed attractive. In one experiment, 67 human subjects viewed side by side an image of a Caucasian male face and the same image 50% masculinized using special computer graphics. Each subject was
Identifying type of urban land cover. Geographical Analysis(Oct. 2006) published a study of a new method for analyzing remote-sensing data from satellite pixels in order to identify urban land cover. The method uses a numerical measure of the distribution of gaps, or the sizes of holes, in the
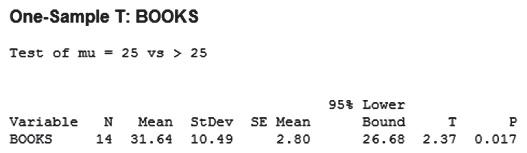
Reading Japanese books. Refer to the Reading in a Foreign Language (Apr. 2004) experiment to improve the Japanese reading comprehension levels of University of Hawaii students presented in Exercise 2.188 (p. 134). Recall that 14 students participated in a 10-week extensive reading program in a
Federal civil trial appeals. Refer to the Journal of the American Law and Economics Association (Vol. 3, 2001) study of appeals of federal civil trials, presented in Exercise 3.170 (p. 205). A breakdown of 678 civil cases that were originally tried in front of a judge and appealed by either the
Choosing portable grill displays. Refer to the Journal of Consumer Research (Mar. 2003) experiment on influencing the choices of others by offering undesirable alternatives, presented in Exercise 3.29 (p. 159). Recall that each of 124 college students selected three portable grills out of five to
Study of lunar soil. Meteoritics (Mar. 1995) reported the results of a study of lunar soil evolution. Data were obtained LO9 from the Apollo 16 mission to the moon, during which a 62-cm core was extracted from the soil near the landing site. Monomineralic grains of lunar soil were separated out and
Solar joint inspections. X-rays and lasers are used to inspect solder-joint defects on printed circuit boards(PCBs). A particular manufacturer of laser-based inspection equipment claims that its product can inspect LO9 at least 10 solder joints per second, on average, when the joints are spaced .1
Effectiveness of skin cream. Pond’s has discontinued the production of Age-Defying Complex, a cream with LO9 alpha-hydroxy acid, with Age-Defying Towlettes. Pond’s advertised that the product could reduce wrinkles and improve the skin. In a study published in Archives of Dermatology(June 1996),
Some quality control experiments require destructive sampling (i.e., the test to determine whether the item is defective destroys the item) in order to measure a particular characteristic of the product. The cost of destructive sampling often dictates small samples. Suppose a manufacturer of
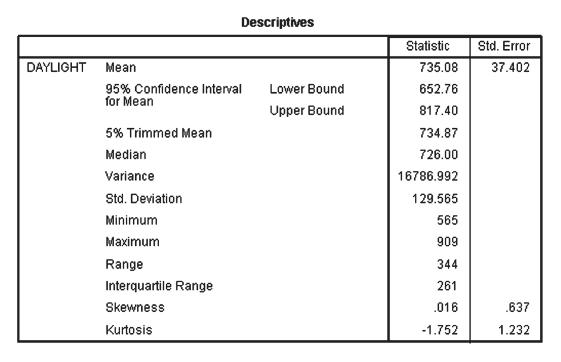
Duration of daylight in western Pennsylvania. What area of the United States has the least amount of daylight, on average?Having grown up in western Pennsylvania, co-author Sincich wonders if it is his hometown of Sharon, PA. Data on the number of minutes of daylight per day in Sharon, PA, for 12
Characteristics of a rockfall. Refer to the Environmental Geology (Vol. 58, 2009) simulation study of how far a block from a collapsing rock wall will bounce down a soil slope, Exercise 2.61 (p. 89). Rebound lengths (in meters)were estimated for 13 rock bounces. The data are repeated in the table.
Find the following probabilities for the standard normal random variable z: LO8a. P1z … 2.32b. P1z 7 2.32c. P1z Ú -1.552d. P1 -2.23 … z … -.4322e. P1 -1.46 … z … 2.162f. P1z … -1.452
For a standard normal random variable, find a z-score, say, z0, such that LO8a. P1z … z02 = .8729b. P1z Ú z02 = .0516c. P1z … z02 = .5d. P1 -z0 … z … z02 = .8132e. P1z Ú z02 = .7995f. P1z Ú z02 = .004
The random variable x has a normal distribution with m = 80 and s = 20. Find the following probabilities: LO8a. P1x … 852b. P1x Ú 1202c. P160 … x … 902d. P1x 7 852e. P1x 6 1302f. P1x = 952
The random variable x has a normal distribution with m = 40 and s2= 36. Find a value of x, say, x0, such that LO8a. P1x Ú x02 = .5b. P1x … x02 = .9909c. P1x … x02 = 54.16d. P1x Ú x02 = .0217e. P1x … x02 = .1075f. P1x Ú x02 = .8051
Assume that x is a binomial random variable with n = 100 and p = .5. Use the normal probability distribution to approximate the following probabilities: LO8a. P1x … 482b. P150 … x … 652c. P1x Ú 702d. P155 … x … 582e. P1x = 622f. P1x … 49 or x Ú 722
Assume that x has an exponential distribution with u = 4.Find LO8a. P1x … 12b. P1x 7 12c. P1x = 1.42d. P1x … 62e. P12 … x … 102
Improving SAT scores. Refer to the Chance (Winter 2001) study of students who paid a private tutor to help them improve their SAT scores, presented in Exercise 2.197 (p. 136). The table summarizing the changes in both the SAT-Mathematics and SAT-Verbal scores for these LO8 students is reproduced
Dart-throwing errors. How accurate are you at the game of darts? Researchers at Iowa State University attempted to develop a probability model for dart throws (Chance, Summer 1997). For each of 590 throws made at certain targets on a dart board, the distance from the dart to the target point was
Marine losses for an oil company. The frequency distribution shown in the accompanying table depicts the property and marine losses incurred by a large oil company over LO8 a two-year period. In the insurance business, each “loss”interval is called a layer. Research Review (Summer
Learn how to identify the target parameter for comparing two populations (9.1) LO5
Learn how to compare two means by using confidence intervals and tests of hypotheses (9.2–9.3) LO5
Apply these inferential methods to problems in which we want to compare two population LO5 proportions, or two population variances (9.4, 9.6)
Determine the sizes of the samples necessary to LO5 estimate the difference between two population parameters with a specified margin of error (9.5)Inferences
A dietitian has developed a diet that is low in fats, carbohydrates, and cholesterol.Although the diet was initially intended to be used by people with heart disease, the dietitian wishes to examine the effect this diet has on the weights of obese people. Two random samples of 100 obese people each
Refer to the study of obese people on a low-fat diet and a regular diet presented in Example 9.1. Another way to compare the mean weight losses for the two different diets is to conduct a test of hypothesis. Suppose we want to determine if the low-fat diet LO5 is more effective than the regular
Find the observed significance level for the test in Example 9.2. Interpret the result. LO5
Suppose you wish to compare a new method of teaching reading to “slow learners” with the current standard method. You decide to base your comparison on the results of a reading test given at the end of a learning period of six months. Of a random LO5 sample of 22 “slow learners,” 10 are
What is the standard error of 1x1 - x22 when the samples are large? LO5
To use the z-statistic to test for a difference between the means of two populations, what assumptions must be made about the two samples? LO5
Two populations are described in each of the cases that follow.In which cases would it be appropriate to apply the LO5 small-sample t-test to investigate the difference between the population means?a. Population 1: Normal distribution with variance s1 2 Population 2: Skewed to the left with
A confidence interval for 1m1 - m22 is 1 -8, 62. Which of the following inferences is correct?a. m1 7 m2 LO5b. m1 6 m2c. m1 = m2d. no significant difference between means
A confidence interval for 1m1 - m22 is 1 -12, -62. Which of the following inferences is correct?a. m1 7 m2b. m1 6 m2c. m1 = m2 LO5d. no significant difference between means
In order to compare the means of two populations, independent random samples of 400 observations are selected from each population, with the following results:Sample 1 Sample 2 LO5 x1 = 5,275 x2 = 5,240 s1 = 150 s2 = 200a. Use a 95% confidence interval to estimate the difference between the
Independent random samples of 100 observations each are chosen from two normal populations with the following means and standard deviations:Population 1 Population 2 m1 = 16 m2 = 12 LO5 s1 = 5 s2 = 4a. Give the mean and standard deviation of the sampling distribution of x1.b. Give the mean and
Assume that s1 2= s2 2= s2. Calculate the pooled estimator LO5 of s2 for each of the following cases:a. s1 2= 180, s2 2= 200, n1 = n2 = 25b. s1 2= 25, s2 2= 40, n1 = 10, n2 = 20c. s1 2= .25, s2 2= .32, n1 = 8, n2 = 12d. s1 2= 2300, s2 2= 2000, n1 = 15, n2 = 18e. Note that the pooled estimate is a
Independent random samples from normal populations produced the following results:Sample 1 Sample 2 1.2 4.2 LO5 3.1 2.7 1.7 3.6 2.8 3.9 3.0a. Calculate the pooled estimate of s2.b. Do the data provide sufficient evidence to indicate that m2 7 m1? Test, using a = .10.c. Find a 90% confidence
Two independent random samples have been selected, 100 observations from population 1 and 100 from population 2.Sample means x1 = 60 and x2 = 40 were obtained. From previous experience with these populations, it is known that the variances are s1 2 LO5= 64 and s2 2= 100.a. Find s1x1 - x22.b. Sketch
Independent random samples are selected from two populations and are used to test the hypothesis H0: 1m1 - m22 = 0 against the alternative Ha: 1m1 - m22 0. An analysis of 243 observations from population 1 and 323 from population 2 yielded a p-value of .125.a. Interpret the results of the test.b.
Independent random samples selected from two normal populations produced the following sample means and LO5 standard deviations:Sample 1 Sample 2 n1 = 12 n2 = 17 x1 = 3.4 x2 = 5.9 s1 = 4.8 s2 = 3.4a. Assuming equal variances, conduct the test H0: 1m1 - m22 = 0 against Ha: 1m1 - m22 0 using a =
Independent random samples selected from two normal populations produced the following sample means and standard deviations: LO5 Sample 1 Sample 2 n1 = 12 n2 = 17 x1 = 3.4 x2 = 5.9 s1 = 4.8 s2 = 3.4a. Assuming equal variances, conduct the test H0: 1m1 - m22 = 0 against Ha: 1m1 - m22 0 using a =
Last name and acquisition timing. The speed with which consumers decide to purchase a product was investigated in the Journal of Consumer Research (Aug. 2011). The researchers theorized that consumers with last names that begin with letters later in the alphabet will tend to acquire items faster
Effectiveness of teaching software. The U.S. Department LO5 of Education (DOE) conducted a national study of the effectiveness of educational software. In one phase of the study, a sample of 1,516 first-grade students in classrooms that used educational software was compared to a sample of 1,103
Cognitive impairment of schizophrenics. A study of the differences in cognitive function between normal individuals and patients diagnosed with schizophrenia was published in the American Journal of Psychiatry (Apr. 2010).The total time (in minutes) a subject spent on the Trail LO5 Making Test (a
Children’s recall of TV ads. Children’s recall and recognition of television advertisements was studied in the Journal of Advertising (Spring 2006). Two groups of children were shown a 60-second commercial for Sunkist FunFruit Rock-n-Roll Shapes. One group (the A/V group) was shown the ad with
Comparing taste test rating protocols. Taste testers of new food products are presented with several competing food samples and asked to rate the taste of each on a 9-point scale LO5(where 1 = “dislike extremely” and 9 = “like extremely”).In the Journal of Sensory Studies (June 2014), food
Lobster trap placement. Refer to the Bulletin of Marine Science (Apr. 2010) study of lobster trap placement, LO5 Exercise 7.41 (p. 363). Recall that the variable of interest was the average distance separating traps—called trap spacing—deployed by teams of fishermen fishing for the red spiny
Shopping vehicle and judgment. Refer to the Journal of Marketing Research (Dec. 2011) study of shopping cart design, Exercise 2.111 (p. 106). Design engineers want to know whether you may be more likely to purchase a vice product (e.g., a candy bar) when your arm is flexed (as when carrying a
basket), and the other half were told to put their arm in an extended position (similar to a shopping cart). Participants were offered several choices between a vice and a virtue LO5(e.g., a movie ticket vs. a shopping coupon, pay later with a larger amount vs. pay now) and a choice score (on a
Do video game players have superior visual attention skills? Researchers at Griffin University (Australia) conducted a study to determine whether video game players have superior visual attention skills compared to non-video game players (Journal of Articles in Support of the Null Hypothesis, Vol.
Hygiene of handshakes, high five and fist bumps. Health professionals warn that transmission of infectious diseases may occur during the traditional handshake greeting. Two alternative methods of greeting (popularized in sports) are the “high five” and the “fist bump.” Researchers compared
How do you choose to argue? In Thinking and Reasoning(Apr. 2007), researchers at Columbia University conducted a series of studies to assess the cognitive skills LO5 required for successful arguments. One study focused on whether one would choose to argue by weakening the opposing position or by
Masculinity and crime. The Journal of Sociology (July 2003) published a study on the link between the level of masculinity and criminal behavior in men. Using a sample of newly incarcerated men in Nebraska, the researcher identified 1,171 violent events and 532 events in which violence was avoided
Showing 2900 - 3000
of 8575
First
23
24
25
26
27
28
29
30
31
32
33
34
35
36
37
Last
Step by Step Answers