New Semester
Started
Get
50% OFF
Study Help!
--h --m --s
Claim Now
Question Answers
Textbooks
Find textbooks, questions and answers
Oops, something went wrong!
Change your search query and then try again
S
Books
FREE
Study Help
Expert Questions
Accounting
General Management
Mathematics
Finance
Organizational Behaviour
Law
Physics
Operating System
Management Leadership
Sociology
Programming
Marketing
Database
Computer Network
Economics
Textbooks Solutions
Accounting
Managerial Accounting
Management Leadership
Cost Accounting
Statistics
Business Law
Corporate Finance
Finance
Economics
Auditing
Tutors
Online Tutors
Find a Tutor
Hire a Tutor
Become a Tutor
AI Tutor
AI Study Planner
NEW
Sell Books
Search
Search
Sign In
Register
study help
business
business statistics
Statistics Plus New Mylab Statistics With Pearson Etext Access Card Package 13th Edition James Mcclave ,Terry Sincich - Solutions
School attendance. A “discrete” uniform distribution was the subject of an article published in the Journal of Probability (Vol. 2014). The random variable of interest was the number of days x in a month that a secondary school student attends a language class. Assume that x can be approximated
Maintaining pipe wall temperature. Maintaining a constant temperature in a pipe wall in some hot process applications is critical. A new technique that utilizes bolt-on trace elements to maintain the temperature was presented in the Journal of Heat Transfer (Nov. 2000). Without bolt-on trace
Social network densities. Social networks involve interactions(connections) between members of the network.Sociologists define network density as the ratio of actual network connections to the number of possible one-to-one connections. For example, a network with 10 members has total possible
Load on timber beams. Timber beams are widely used in home construction. When the load (measured in pounds) per unit length has a constant value over part of a beam, the load is said to be uniformly distributed over that part of the beam.Uniformly distributed beam loads were used to derive the
Cycle availability of a system. In the jargon of system maintenance,“cycle availability” is defined as the probability that a system is functioning at any point in time. The U.S.Department of Defense developed a series of performance measures for assessing system cycle availability (START, Vol.
Soft-drink dispenser. The manager of a local soft-drink bottling company believes that when a new beveragedispensing machine is set to dispense 8 ounces, it in fact dispenses an amount x at random anywhere between 7.5 and 8.5 ounces, inclusive. Suppose x has a uniform probability distribution.a. Is
Time delays at a bus stop. A bus is scheduled to stop at a certain bus stop every half hour on the hour and the half hour. At the end of the day, buses still stop after every 30 minutes, but because delays often occur earlier in the day, the bus is never early and is likely to be late. The director
Gouges on a spindle. A tool-and-die machine shop produces extremely high-tolerance spindles. The spindles are 18-inch slender rods used in a variety of military equipment.A piece of equipment used in the manufacture of the spindles malfunctions on occasion and places a single gouge somewhere on the
Reliability of a robotic device. The reliability of a piece of equipment is frequently defined to be the probability p that the equipment performs its intended function successfully for a given period under specific conditions (Render and Heizer, Principles of Operations Management, 1995).Because p
True or False: The normal distribution is a symmetric probability distribution.
If x has a normal distribution with mean m and standard deviation s, find the mean of the random variable z = 1x - m2 >s.
How do you transform a normal random variable to a standard normal random variable?
Find the area under the standard normal probability distribution between the following pairs of z-scores:a. z = 0 and z = 1.90b. z = 0 and z = .90c. z = 0 and z = 2.90d. z = 0 and z = 0e. z = -1.90 and z = 0f. z = -.90 and z = 0 g. z = -1.59 and z = 0 h. z = -.48 and z = 0
Find each of the following probabilities for a standard normal random variable z:a. P1z = 12b. P1z … 12c. P1z 6 12d. P1z 7 12e. P1 -1 … z … 12f. P1 -2 … z … 22 g. P1 -2.16 … z … .552 h. P1 -.42 6 z 6 1.962
Find the following probabilities for the standard normal random variable z:a. P1z 7 1.462b. P1z 6 -1.562c. P1.67 … z … 2.412d. P1 -1.96 … z 6 -.332e. P1z Ú 02f. P1 -2.33 6 z 6 1.502 g. P1z Ú -2.332 h. P1z 6 2.332
Give the z-score for a measurement from a normal distribution for the following:a. 2 standard deviation above the meanb. 2 standard deviation below the meanc. Equal to the meand. 2.5 standard deviations above the meane. 3 standard deviations above the mean
Find a value z0 of the standard normal random variable z such thata. P1z … z02 = .0401b. P1 -z0 … z … z02 = .95c. P1 -z0 … z … z02 = .90d. P1 -z0 … z … z02 = .8740e. P1 -z0 … z … 02 = .2967f. P1 -2 6 z 6 z02 = .9710 g. P1z Ú z02 = .5 h. P1z Ú z02 = .0057
Find a value z0 of the standard normal random variable z such thata. P1z Ú z02 = .10b. P1z Ú z02 = .003c. P1z … z02 = .01d. P1z Ú z02 = .20e. P1z 7 z02 = .02
Suppose the random variable x is best described by a normal distribution with m = 36 and s = 6. Find the z-score that corresponds to each of the following x values:a. x = 36b. x = 42c. x = 47.5d. x = 18e. x = 66f. x = 50
Suppose x is a normally distributed random variable with m = 11 and s = 2. Find each of the following:a. P110 … x … 122b. P16 … x … 102c. P113 … x … 162d. P17.8 … x … 12.62e. P1x Ú 13.242f. P1x Ú 7.622
Suppose x is a normally distributed random variable with m = 40 and s = 10. Find a value x0 of the random variable x such thata. P1x Ú x02 = .5b. P1x 6 x02 = .025c. P1x 7 x02 = .10d. P1x 7 x02 = .95
Suppose x is a normally distributed random variable with mean 100 and standard deviation 8. Draw a rough graph of the distribution of x. Locate m and the interval m { 2s on the graph. Find the following probabilities:a. P1m - 3s … x … m + 3s2b. P1x Ú m + 3s2c. P1x … 842d. P184 … x …
The random variable x has a normal distribution with standard deviation 20. It is known that the probability that x exceeds 150 is .90. Find the mean m of the probability distribution.
The random variable x has a normal distribution with m = 200 and s = 20.a. Find the probability that x assumes a value more than two standard deviations from its mean. More than three standard deviations from m.b. Find the probability that x assumes a value within one standard deviation of its
Dental anxiety study. To gauge their fear of going to a dentist, a random sample of adults completed the Modified Dental Anxiety Scale questionnaire (BMC Oral Health, Vol. 9, 2009). Scores on the scale range from zero (no anxiety)to 25 (extreme anxiety). The mean score was 11 and the standard
Tomato as a taste modifier. Miraculin—a protein naturally produced in a rare tropical fruit—can convert a sour taste into a sweet taste; thus, it has the potential to be an alternative low-calorie sweetener. In Plant Science (May 2010), a group of Japanese environmental scientists investigated
Deep mixing of soil. Deep mixing is a ground improvement method developed for soft soils like clay, silt, and peat.Swedish civil engineers investigated the properties of soil improved by deep mixing with lime-cement columns in the journal Giorisk (Vol. 7, 2013). The mixed soil was tested by
Casino gaming. In Chance (Spring 2005), University of Denver statistician R. C. Hannum discussed casino gaming and the laws of probability. Casino games of pure chance (e.g., craps, roulette, baccarat, and keno) always yield a “house advantage.” For example, in the game of double-zero roulette,
Shopping vehicle and judgment. Refer to the Journal of Marketing Research (Dec. 2011) study of whether you are more likely to choose a vice product (e.g., a candy bar)when your arm is flexed (as when carrying a shopping basket)than when your arm is extended (as when pushing a shopping cart),
Shell lengths of sea turtles. Refer to the Aquatic Biology(Vol. 9, 2010) study of green sea turtles inhabiting the Grand Cayman South Sound lagoon, Exercise 2.85(p. 97).Researchers discovered that the curved carapace (shell)length of these turtles is approximately normally distributed with mean
Optimal goal target in soccer. When attempting to score a goal in soccer, where should you aim your shot? Should you aim for a goalpost (as some soccer coaches teach), the middle of the goal, or some other target? To answer these questions, Chance (Fall 2009) utilized the normal probability
Voltage sags and swells. Refer to the Electrical Engineering(Vol. 95, 2013) study of the power quality of a transformer, Exercise 2.127(p. 110). Recall that two causes of poor power quality are “sags” and “swells.” (A sag is an unusual dip and a swell is an unusual increase in the voltage
Safety of underground tunnels. Research published in the journal Tunnelling and Underground Space Technology(July 2014) evaluated the safety of underground tunnels built in rigid soils. A Factor of Safety (FS), measured as the ratio of capacity over demand, was determined for three different areas
Ambulance response time. Ambulance response time is measured as the time (in minutes) between the initial call to emergency medical services (EMS) and when the patient is reached by ambulance. Geographical Analysis(Vol. 41, 2009) investigated the characteristics of ambulance response time for EMS
Rating employee performance. Almost all companies utilize some type of year-end performance review for their employees. Human Resources (HR) at the University of Texas Health Science Center provides guidelines for supervisors rating their subordinates. For example, raters are advised to examine
California’s electoral college votes. During a presidential election, each state is allotted a different number of votes to the electoral college depending on population. For example, California is allotted 55 votes (the most) while several states (including the District of Columbia) are allotted
Alcohol, threats, and electric shocks. A group of Florida State University psychologists examined the effects of alcohol on the reactions of people to a threat (Journal of Abnormal Psychology, Vol. 107, 1998). After obtaining a specified blood alcohol level, the psychologists placed experimental
Box plots and the standard normal distribution. What relationship exists between the standard normal distribution and the box-plot methodology (Section 2.7) for describing distributions of data by means of quartiles?The answer depends on the true underlying probability distribution of the data.
Load on frame structures. In the Journal of the International Association for Shell and Spatial Structures (Apr. 2004), Japanese environmental researchers studied the performance of truss-and-frame structures subjected to uncertain loads. The load was assumed to have a normal distribution with a
Range of women’s heights. In Chance (Winter 2007), Yale Law School professor Ian Ayres published the results of a study he conducted with his son and daughter on whether college students could estimate a range for women’s heights. The students were shown a graph of a normal distribution of
Executive coaching and meeting effectiveness. Poor executive leadership during business meetings can result in counterproductive outcomes (e.g., negative employee attitudes, ambiguous objectives). Can executive coaching help improve business meeting effectiveness? This was the question of interest
How do you construct a normal probability plot of a data set from a normal population?
If a population data set is normally distributed, what is the proportion of measurements you would expect to fall within the following intervals?a. m { .5sb. m { 2.5sc. m { 1.25s
How do you use IQR to check that the data came from a standard normal distribution?
Normal probability plots for three data sets are shown at the bottom of the page. Which plot indicates that the data are approximately normally distributed? Plots for Exercise 5.59 y 800 800 800 700 700 700 600 600 600 500 500 00 500 400 400 400 300 300 300 200 200 200 100 100 100 +x x+ 01 2 3 4 5
Consider a sample data set with the following summary statistics: s = 190, QL = 144, and QU = 390.a. Calculate IQR.b. Calculate IQR/s.c. Is the value of IQR/s approximately equal to 1.3? What does this imply?
Examine the following sample data.a. Construct a stem-and-leaf plot to assess whether the data are from an approximately normal distribution.b. Find the values of QL, QU, and s for the sample data.c. Use the results from part b to assess the normality of the data.d. Generate a normal probability
Examine the sample data in the next column.L05062a. Construct a stem-and-leaf plot to assess whether the data are from an approximately normal distribution.b. Compute s for the sample data.c. Find the values of QL and QU and the value of s from part b to assess whether the data come from an
Irrelevant speech effects. Refer to the analysis of irrelevant speech effects in Exercise 2.34(p. 77). Recall that irrelevant speech effects refer to the degree to which the memorization process is impaired by irrelevant background speech. In a study published in Acoustical Science& Technology
Characteristics of antiwar demonstrators. Refer to the American Journal of Sociology (Jan. 2014) study of the characteristics of antiwar demonstrators in the United States, Exercise 2.106(p. 105). Based on data collected for over 5,000 antiwar demonstrators over a recent 3-year period, the
Software file updates. Software configuration management was used to monitor a software engineering team’s performance at Motorola, Inc. (Software Quality Professional, Nov. 2004). One of the variables of interest was the number of updates to a file changed because of a problem report. Summary
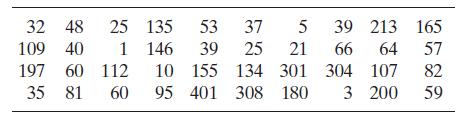
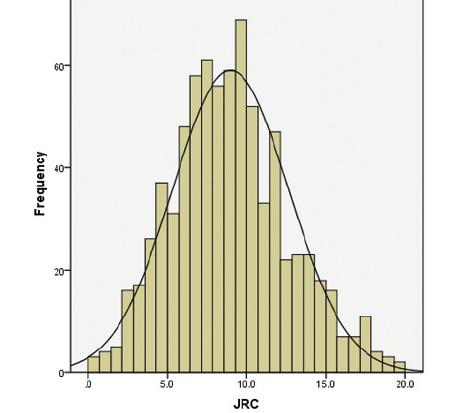
Shear strength of rock fractures. Understanding the characteristics of rock masses, especially the nature of the fractures, are essential when building dams and power plants.The shear strength of rock fractures was investigated in Engineering Geology (May 12, 2010). The Joint Roughness Coefficient
Estimating glacier elevations. Digital elevation models(DEMs) are now used to estimate elevations and slopes of remote regions. In Arctic, Antarctic, and Alpine Research(May 2004), geographers analyzed reading errors from maps produced by DEMs. Two readers of a DEM map of White Glacier (in Canada)
Drug content assessment. Scientists at GlaxoSmithKline Medicines Research Center used high-performance liquid chromatography (HPLC) to determine the amount of drug in a tablet produced by the company (Analytical Chemistry, Dec. 15, 2009). Drug concentrations (measured as a percentage) for 50
Mineral flotation in water study. Refer to the Minerals Engineering (Vol. 46–47, 2013) study of the impact of calcium and gypsum on the flotation properties of silica in water, Exercise 2.48(p. 81). Recall that 50 solutions of deionized water were prepared both with and without calcium/gypsum,
Habitats of endangered species. An evaluation of the habitats of endangered salmon species was performed in Conservation Ecology (Dec. 2003). The researchers identified 734 sites (habitats) for Chinook, coho, or steelhead salmon species in Oregon and assigned a habitat quality score to each site.
Baseball batting averages. Major League Baseball (MLB)has two leagues: the American League (AL), which utilizes the designated hitter (DH) to bat for the pitcher, and the National League (NL), which does not allow the DH. A player’s batting average is computed by dividing the player’s total
Ranking the driving performance of professional golfers.Refer to The Sport Journal (Winter 2007) article on a new method for ranking the driving performance of PGA golfers, presented in Exercise 2.66(p. 90). Recall that the method incorporates a golfer’s average driving distance (yards) and
Permeability of sandstone during weathering. Refer to the Geographical Analysis (Vol. 42, 2010) study of the decay properties of sandstone when exposed to the weather, Exercise 2.69(p. 91). Recall that blocks of sandstone were cut into 300 equal-sized slices and the slices randomly divided into
Cruise ship sanitation scores. Refer to the data on the Aug.2013 sanitation scores for 186 cruise ships, presented in Exercise 2.41(p. 79). The data are saved in the SANIT file.Assess whether the sanitation scores are approximately normally distributed.
Blond hair types in the Southwest Pacific. Refer to the American Journal of Physical Anthropology (Apr. 2014)study of a mutation of blond-hair genotypes, Exercise 2.141(p. 119). Recall that for each of 550 Southwest Pacific islanders, the effect of the mutation on hair pigmentation was measured
Ranking Ph.D. programs in economics. Refer to the Southern Economic Journal (Apr. 2008) rankings of Ph.D. programs in economics at 129 colleges and universities, Exercise 2.129(p. 111). Recall that the number of publications published by faculty teaching in the Ph.D.program and the quality of the
When will the normal distribution provide a reasonable approximation to the probabilities of most binomial events?
Can a binomial distribution with parameters n = 10 and p = .1 be well approximated by a normal distribution?
Suppose x is a binomial random variable with p = .4 and n = 25.a. Would it be appropriate to approximate the probability distribution of x with a normal distribution?Explain.b. Assuming that a normal distribution provides an adequate approximation to the distribution of x, what are the mean and
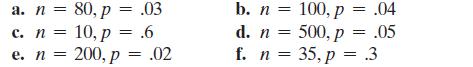
Assume that x is a binomial random variable with n and p as specified in parts a–f that follow. For which cases would it be appropriate to use a normal distribution to approximate the binomial distribution? a. n = 80, p = .03 c. n = 10, p = .6 e. n = 200, p = .02 b. n=100, p = .04 d. n = 500, p =
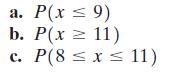
Assume that x is a binomial random variable with n = 20 and p = .5. Use Table I of Appendix B and the normal approximation to find the exact and approximate values, respectively, of the following probabilities: a. P(x 9) b. P(x11) C. P(8 x 11)
Assume that x is a binomial random variable with n = 1,200 and p = .50. Find each of the following probabilities: a. P(x > 600) c. P(x > 655) b. P(589 x 600)
Assume that x is a binomial random variable with n = 120 and p = .50. Use a normal approximation to find the following: a. P(x 55) b. P(60x80) c. P(x = 58)
Blood diamonds. According to Global Research News(Mar. 4, 2014), one-fourth of all rough diamonds produced in the world are blood diamonds, i.e., diamonds mined to finance war or an insurgency. In a random sample of 1,000 rough diamonds purchased by a diamond buyer, let x be the number that are
Working on summer vacation. In Exercise 4.68 (p. 240), you learned that 30% of adults do not work at all while on summer vacation. Now consider a random sample of 1,500 adults and let x represent the number who do not work during summer vacation.a. What is the expected value of x? Interpret this
Where will you get your next pet? Refer to Exercise 4.70 (p. 240) and the associated poll that revealed that half of all pet owners would get their next dog or cat from a shelter.Consider a random sample of 700 pet owners and define x as the number of pet owners who would acquire their next dog
Analysis of bottled water. Refer to the report on whether bottled water is really purified water, presented in Exercise 4.72 (p. 240). Recall that the Natural Resources Defense Council found that 25% of bottled-water brands fill their bottles with just tap water. In a random sample of 70
LASIK surgery complications. According to studies, 1%of all patients who undergo laser surgery (i.e., LASIK) to correct their vision have serious post-laser vision problems (All About Vision, 2014). In a random sample of 200,000 LASIK patients, let x be the number who experience serious
Cesarean birth study. In Exercise 4.73 (p. 240), you learned that 75% of all births in a region occur by Cesarean section each year. In a random sample of 1,000 births this year, let x be the number that occur by Cesarean section.a. Find the mean of x.b. Find the standard deviation of x.
Chemical signals of mice. Refer to the Cell (May 14, 2010)study of the ability of a mouse to recognize the odor of a potential predator, Exercise 4.71(p. 240). You learned that 40% of lab mice cells exposed to chemically produced major urinary proteins (Mups) from a cat responded positively(i.e.,
Ecotoxicological survival study. The Journal of Agricultural, Biological and Environmental Statistics (Sept.2000) gave an evaluation of the risk posed by hazardous pollutants. In the experiment, guppies (all the same age and size) were released into a tank of natural seawater polluted with the
Fingerprint expertise. Refer to the Psychological Science(Aug. 2011) study of fingerprint identification, Exercise 4.74(p. 240). Recall that the study found that when presented with prints from the same individual, a novice will correctly identify the match only 75% of the time. Now consider a
Hotel guest satisfaction. Refer to the Hotel Guest Satisfaction Index Study, Exercise 4.75(p. 241). You determined that the probability of a hotel guest participating in the hotel’s “green” conservation program by reusing towels and bed linens is .455. Suppose a large hotel chain randomly
Body fat in men. The percentage of fat in the bodies of some men is an approximately normal random variable with mean equal to 20% and standard deviation equal to 4%.a. If these values were used to describe the body fat of men in the army, and if a measure of 30% or more body fat characterizes the
Marital name changing. Refer to the Advances in Applied Sociology (Nov. 2013) study of marital name changing, Exercise 4.78(p. 241). Recall that the probability that an American female will change her last name upon marriage is .9. In a sample of 500 European females, suppose researchers find that
Waiting time at an emergency room. According to Health Affairs (Oct. 28, 2004), the median time a patient waits to see a doctor in a typical U.S. emergency room is 30 minutes. On a day when 150 patients visit the emergency room, what is the approximate probability thata. More than half will wait
What is the nature of the probability density function of an exponential random variable?
The exponential distribution is often called the ________ distribution. (Fill in the blank.)
Determine the value of e-a>u for each of the following cases: = a. 02, a 2 c. = .8, a = 6 b. 0 = 2, a = 5 d. 0.4, a .6 =
Suppose x has an exponential distribution with u = 1. Find the following probabilities: a. P(x1) c. P(x 1.5) b. P(x3) d. P(x = 5)
The random variable x can be adequately approximated by an exponential probability distribution with u = 3. Find the probability that x assumes a valuea. More than three standard deviations from m.b. Less than two standard deviations from m.c. Within half a standard deviation of m.
Suppose the random variable x has an exponential probability distribution with u = 3. Find the mean and standard deviation of x. Find the probability that x will assume a value within the interval m { 2s.
Bus interarrival times. In the Social and Natural Sciences Journal (Vol. 6, 2012), the time x (in minutes) between two successive arrivals of buses was modeled using an exponential distribution with mean u = 3.77.a. Give the value of E(x).b. What is the standard deviation of x?c. Find P1x 7 52.
Lead in metal shredder residue. On the basis of data collected from metal shredders across the nation, the amount x of extractable lead in metal shredder residue has an approximate exponential distribution with mean u = 2.5 milligrams per liter (Florida Shredder’s Association).a. Find the
Critical-part failures in NASCAR vehicles. In NASCAR races such as the Daytona 500, 43 drivers start the race;however, about 10% of the cars do not finish due to the failure of critical parts. University of Portland professors conducted a study of critical-part failures from 36 NASCAR races (The
Phishing attacks to e-mail accounts. Refer to the Chance(Summer 2007) article on phishing attacks at a company, Exercise 2.47(p. 81). Recall that phishing describes an attempt to extract personal/financial information through fraudulent e-mail. The company set up a publicized e-mail
Preventative maintenance tests. The optimal scheduling of preventative maintenance tests of some (but not all) of n independently operating components was developed in Reliability Engineering and System Safety (Jan. 2006). The time (in hours) between failures of a component was approximated by an
Earthquake recurrence in Iran. The Journal of Earthquake Engineering (Vol. 17, 2013) modeled the time x (in years)between major earthquakes occurring in the Iranian Plateau. One of the models considered had the following density function:a. Find E(x). Interpret the result.b. Find the variance of
Forest fragmentation study. Refer to the Conservation Ecology (Dec. 2003) study on the causes of fragmentation in 54 South American forests, presented in Exercise 2.166(p. 125). Recall that the cause is classified as either anthropogenic or natural in origin. The anthropogenic fragmentation index
Ship-to-shore transfer times. Lack of port facilities or shallow water may require cargo on a large ship to be transferred to a pier in smaller craft. The smaller craft may have to cycle back and forth from ship to shore many times.An exponential distribution in Naval Research Logistics, Vol. 41,
Product failure behavior. An article in Hotwire (Dec.2002) discussed the length of time till failure of a product produced at Hewlett-Packard. At the end of the product’s lifetime, the time till failure is modeled using an exponential distribution with mean 500 thousand hours. In reliability
Length of life of a halogen bulb. For a certain type of halogen light bulb, an old bulb that has been in use for a while tends to have a longer life than a new bulb. Let x represent the life (in hours) of a new halogen light bulb, and assume that x has an exponential distribution with mean u = 250
Consider the continuous random variables that follow.Give the probability distribution (uniform, normal, or exponential)that is likely to best approximate the distribution of the random variable:a. The weekly wage distribution of workers in a factoryb. The lifetime of a light bulb.c. The systolic
Find the following probabilities for the standard normal random variable z: a. P(z 2.3) b. P(z > 2.3) z -.432) c. P(z -1.55) d. P(-2.23 e. P(-1.46 f. P(z -1.45) z 2.16)
Showing 3500 - 3600
of 8575
First
29
30
31
32
33
34
35
36
37
38
39
40
41
42
43
Last
Step by Step Answers