New Semester
Started
Get
50% OFF
Study Help!
--h --m --s
Claim Now
Question Answers
Textbooks
Find textbooks, questions and answers
Oops, something went wrong!
Change your search query and then try again
S
Books
FREE
Study Help
Expert Questions
Accounting
General Management
Mathematics
Finance
Organizational Behaviour
Law
Physics
Operating System
Management Leadership
Sociology
Programming
Marketing
Database
Computer Network
Economics
Textbooks Solutions
Accounting
Managerial Accounting
Management Leadership
Cost Accounting
Statistics
Business Law
Corporate Finance
Finance
Economics
Auditing
Tutors
Online Tutors
Find a Tutor
Hire a Tutor
Become a Tutor
AI Tutor
AI Study Planner
NEW
Sell Books
Search
Search
Sign In
Register
study help
business
business statistics
Medical Statistics A Textbook For The Health Sciences 5th Edition Stephen J. Walters, Michael J. Campbell, David Machin - Solutions
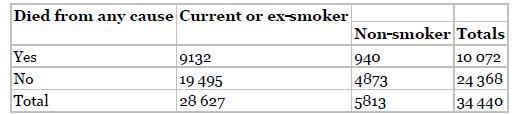
From the data in Table 14.11 what is the risk of dying from any cause in the 20‐year follow‐up in the unexposed (non‐smoker) group?A. 0.162 B. 0.292 C. 0.319 D. 0.681 E. 0.838 Table 14.11 Died from any cause Current or ex-smoker Non-smoker Totals Yes No 9132 19 495 940 10 072 4873 24 368
From the data in Table 14.11 what is the absolute risk difference (difference in proportions) for dying from any cause in the 20‐year follow‐up between current or ex‐smokers and non‐smokers?A. −0.162 B. −0.139 C. 0.019 D. 0.157 E. 0.319 Table 14.11 Died from any cause Current or
From the data in Table 14.11 what is the relative risk for dying for current or ex‐smokers compared to non‐smokers?A. 0.41 B. 0.51 C. 1.97 D. 2.03 E. 2.43 Table 14.11 Died from any cause Current or ex-smoker Non-smoker Totals Yes No 9132 19 495 940 10 072 4873 24 368 Total 28 627 5813 34 440
Using the data in Table 14.11 calculate the 95% confidence interval for the relative risk for dying for current or ex‐smokers compared to non‐smokers?A. 0.61 to 0.74 B. 0.74 to 1.86 C. 1.17 to 2.10 D. 1.86 to 2.10 E. 5.97 to 26.55 Table 14.11 Died from any cause Current or ex-smoker Non-smoker
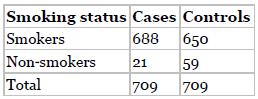
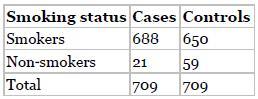
Using the data in Table 14.12 what is the odds ratio for lung cancer cases compared to controls for being a smoker?A. 0.34 B. 1.05 C. 2.97 D. 11.02 E. 32.76Table 14.12 Smoking status Cases Controls Smokers 688 650 Non-smokers 21 59 Total 709 709
Using the data in Table 14.12 calculate the 95% confidence interval for the odds ratio for lung cancer cases compared to control for being a smoker?A. 0.64 to 1.54 B. 0.68 to 1.66 C. 1.79 to 4.95 D. 2.86 to 4.10 E. 3.97 to 55Table 14.12 Smoking status Cases Controls Smokers 688 650 Non-smokers
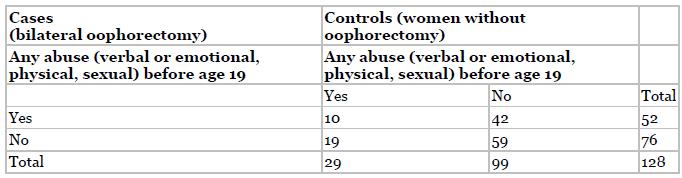
From the data on Table 14.13; what is the odds ratio for cases compared to controls for any abuse (verbal or emotional, physical, sexual) before age 19?A. 0.18 B. 0.45 C. 2.21 D. 3.23 E. 5.70Table 14.13 Cases (bilateral oophorectomy) Any abuse (verbal or emotional, physical, sexual) before age 19
Using the data in Table 14.13 calculate the value of McNemar's test statistic without continuity correction for investigating the association between an ACE and bilateral oophorectomy.A. 0.18 B. 1.30 C. 2.21 D. 3.75 E. 8.67Table 14.13 Cases (bilateral oophorectomy) Any abuse (verbal or emotional,
Using the data in Table 14.13 calculate the 95% confidence interval for the odds ratio for cases compared to controls for any abuse (verbal or emotional, physical, sexual) before age 19?A. 1.00 to 2.62 B. 1.30 to 23.75 C. 1.79 to 25.82 D. 1.86 to 22.10 E. 5.97 to 226.55Table 14.13 Cases (bilateral
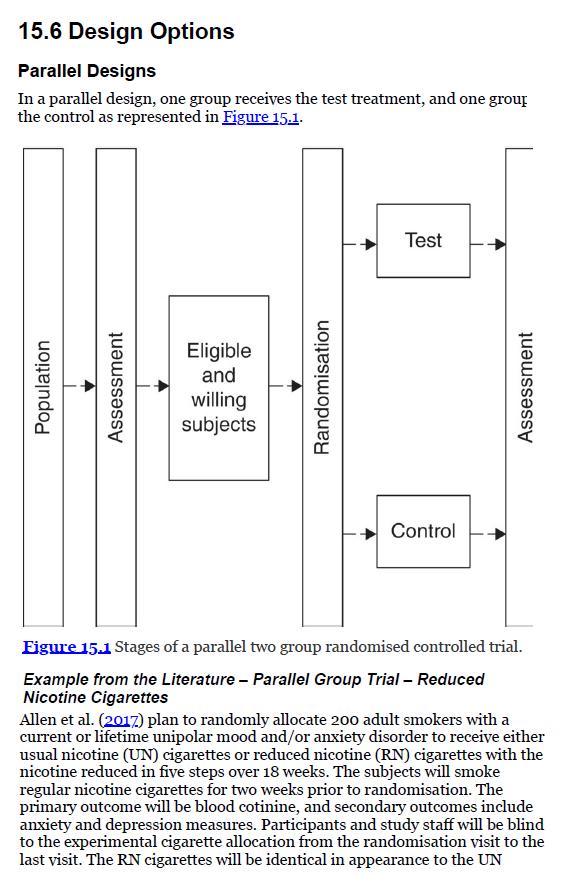
The Allen et al. (2017) trial planned to randomly allocate 200 adult smokers with a current or lifetime unipolar mood and/or anxiety disorder to receive either UN cigarettes or RN cigarettes with the nicotine reduced in five steps over 18 weeks. With reference to this trial which of the following
Berkowitz et al. (2018) conducted a trial of a home delivery of 10 meals per week for 12 weeks against usual diet and a healthy eating brochure. With reference to this cross‐over trial which of the following statements, if any, are true?A. The cross‐over design is a ‘within subjects’ study
With reference to the REPOSE trial (2017) of Section 15.6 which of the following statements, if any, are true A. The subjects were blind to treatment.B. The subjects were randomised individually to MDIs or pumps.C. All subjects got pumps in the end.D. The trial showed a clear benefit of pumps
When calculating the required sample size for a two‐group superiority RCT with a continuous outcome which of ONE of the following pieces of information is NOT required?A. The probability of a Type I error.B. The probability of a Type II error.C. The variability or standard deviation of the
Which ONE of the following statements about how the required sample size for a study changes is INCORRECT?A. Goes up with a smaller Type I error.B. Goes up with smaller Type II error.C. Goes up with a larger power.D. Goes down with a larger power.E. Goes down with a larger effect size.
Which ONE of the following statements about the Type I error is INCORRECT?A. The Type I error is the probability of rejecting the null hypothesis when it is true.B. The Type I error is the probability of a false positive result.C. The usual level for Type I error rate in sample size calculations is
Which ONE of the following statements about the Type II error is INCORRECT?A. The Type II error is the probability of rejecting the null hypothesis when it is true.B. The Type II error is the probability of a false negative result.C. The usual level for Type II error rate in sample size
When calculating the required sample size for a two‐group superiority RCT with a binary outcome which of ONE of the following pieces of information is NOT required?A. The probability of a Type I error.B. The probability of a Type II error.C. The variability or standard deviation of the outcome.D.
Which ONE of the following statements about the SES ΔPlan used in the sample size formula for continuous data is INCORRECT?A. ΔPlan is calculated as the difference in means divided by the standard deviation of the outcome.B. Goes down with a larger standard deviation C. Goes up with a larger
The SES for the sample size calculation is:A. 0.20 B. 0.30 C. 0.33 D. 0.35 E. 0.40
Work out how many patients (in total in both groups combined) need to be recruited to the‘Quickheal’ trial with a 5% (two‐sided) significance level and a power of 80%?A. 100 B. 193 C. 132 D. 200 E. 264
How many patients in each group would need to be recruited to the ‘Quickheal’ trial with a 5%(two‐sided) significance level and a power of 90%?A. 100 B. 193 C. 132 D. 200 E. 264
Suppose the effect of the new dressing on ulcer healing will be considered important if it increases the number of ulcer‐free weeks, at one‐year post‐randomisation, by at least 10 weeks. The SES for the sample size calculation is:A. 0.20 B. 0.30 C. 0.30 D. 0.40 E. 0.50
Suppose the primary outcome for the study is changed to a binary outcome of whether or not the ulcer had healed at three month post‐randomisation. Published data on ulcer healing rates in this population suggest an ulcer healing rate of 20%. Suppose the effect of the new dressing will be
Use the appropriate sample size formula to work out how many patients in each group need to be recruited to such a trial with a 5% (two‐sided) significance level and a power of 90%?A. 291 B. 389 C. 582 D. 778 E. 1251
Which if any of the following statements about types and patterns of missing data IS CORRECT?A. Data is MCAR when the probability of a response at time t is independent of both the previously observed values and the unobserved values at time t.B. Data is MAR when the probability of response at time
Which if any of the following statements about the analysis of missing data IS CORRECT?A. We cannot test whether or not the data are MNAR B. Complete case analyses assumes the missing outcome data are MNAR.C. Multiple imputation assumes the missing outcome data are MNAR.D. Pattern mixture models
Which if any of the following is not a method of imputing missing data?A. Multiple imputation B. One at a time imputation C. Hot deck imputation D. Mean imputation E. Last observation carried forward imputation
Which if any of the following statements about the bootstrap method is INCORRECT?A. The bootstrap method involves repeatedly drawing random samples from the original data B. The bootstrap method involves repeatedly drawing random samples from the original data, with replacement C. Bootstrap methods
Which if any of the following IS NOT a recognised method of estimating bootstrap confidence intervals?A. Percentile B. Bias corrected and accelerated C. Bias corrected D. Normal E. Jackknife
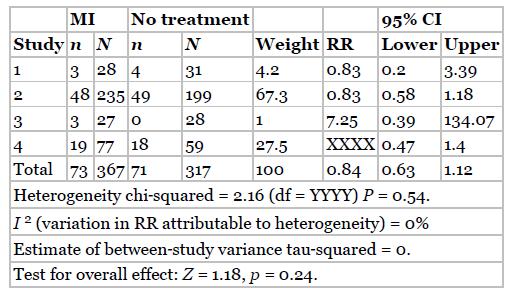
From the data in Table 18.3 calculate XXXX, the missing RR for Study 4.A. 0.81 B. 0.89 C. 1.05 D. 1.78 E. 2.34Table 18.3 MI No treatment 95% CI Study n N n N Weight RR Lower Upper 1 3 284 31 4.2 0.83 0.2 3.39 2 48 235 49 199 67.3 0.83 0.58 1.18 34 3 3 27 0 28 1 7.25 0.39 134.07 19 77 18 59 27.5
What are the degrees of freedom (labelled YYYY in Table 18.3) for the chi‐squared test of heterogeneity?A. 1 B. 2 C. 3 D. 4 E. 5Table 18.3 MI No treatment 95% CI Study n N n N Weight RR Lower Upper 1 3 284 31 4.2 0.83 0.2 3.39 2 48 235 49 199 67.3 0.83 0.58 1.18 34 3 3 27 0 28 1 7.25 0.39 134.07
Table 18.3 reports that the P‐value for the test for heterogeneity is P = 0.54.Which, if any, of the following statements is CORRECT?A. The result is statistically significant.B. The probability of getting this difference or more extreme by chance if the studies are homogenous is 0.54.C. The
Table 18.3 reports that the P‐value for the test for overall effect is P = 0.24.Which, if any, of the following statements is CORRECT?A. The result is not statistically significant.B. The probability of getting this difference or one more extreme, when the null hypothesis (of no overall effect)
Table 18.3 reports that the overall or pooled 95% CI for the RR across the four trials for stopping smoking in the MI group compared to the no treatment control group is 0.63 to 1.12.Which, if any, of the following statements is CORRECT?A. The above 95% CI definitely contains the true population RR
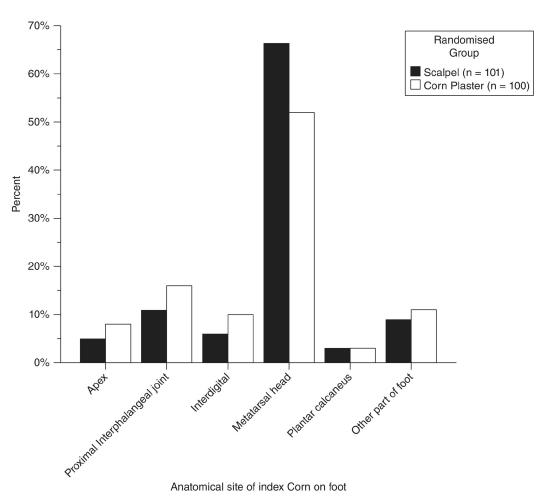
What type of graph is Figure 2.11?A. Bar chart B. Pie chart C. Histogram D. Scatterplot E. Dot plotFigure 2.11 Percent 70% 60% Randomised Group Scalpel (n = 101) Corn Plaster (n = 100) 50% 40% 30% 20% 10% 0% Apex Proximal Interphalangeal joint" Interdigital Metatarsal head Plantar calcaneus
What type of data in Figure 2.11 is anatomical site of foot corn?A. Discrete B. Nominal C. Binary D. Ordinal E. ContinuousFigure 2.11 Percent 70% 60% Randomised Group Scalpel (n = 101) Corn Plaster (n = 100) 50% 40% 30% 20% 10% 0% Apex Proximal Interphalangeal joint" Interdigital Metatarsal
Using the data shown in Figure 2.11 which anatomical site of the corn on the foot was the least frequently reported patients in the corn plaster group?The least frequently reported anatomical site of the corn on the foot patients in the corn plaster group was:A. Apex B. Proximal interphalangeal
Using the data shown in Figure 2.11, approximately how many patients in the scalpel treated group had corn on the proximal interphalangeal joint (middle part of toe on the top)?The approximate number of patients in the scalpel treated group with a corn on the proximal interphalangeal joint was:A.
Using the data shown in Figure 2.11, what approximate percentage of the sample of patients in the corn plaster treated group had a corn on the metatarsal head (ball of the foot at the bottom)?The approximate percentage of patients in the corn plaster treated group who had a corn on the metatarsal
The mean corn size (in mm) for this sample of 10 patients is:A. 1.0 B. 2.0 C. 3.0 D. 4.0 E. 4.4
The median corn size (in mm) for this sample of 10 patients is:A. 1.0 B. 2.0 C. 3.0 D. 4.0 E. 4.4
The modal corn size (in mm) for this sample of 10 patients is:A. 1.0 B. 2.0 C. 3.0 D. 4.0 E. 4.4
The range of corn sizes (in mm) for this sample of 10 patients is:A. 1 to 10 B. 2 to 5 C. 2 to 10 D. 3 to 11 E. 3 to 12
The interquartile range (IQR) corn size (in mm) for this sample of 10 patients is:A. 2 to 10 B. 2 to 7 C. 2 to 5 D. 3 to 7 E. 3 to 10
The variance in corn size (in mm2) for this sample of 10 patients is:A. 0.8 B. 2.5 C. 3.5 D. 4.4 E. 6.5
The standard deviation corn size (in mm) for this sample of 10 patients is:A. 0.8 B. 2.5 C. 3.5 D. 4.4 E. 6.5
What proportion of patients in the Band‐aid group had a completely healed leg ulcer at 12 months?A. 0.30 B. 0.40 C. 0.60 D. 0.65 E. 0.70
What proportion of patients had a completely healed leg ulcer at 12 months in the control group?A. 0.30 B. 0.40 C. 0.60 D. 0.65 E. 0.70
What is the difference in response (leg ulcer healing rates at 12 months) between the Band‐aid and control groups?A. −0.10 B. −0.05 C. 0.00 D. 0.05 E. 0.10
Calculate the number of people needed to be treated with Bandaid dressing in order for an additional person to have a completely healed leg ulcer at 12 months compared to people usual care?A. 6 B. 7 C. 8 D. 8 E. 10
What is the relative risk for the leg ulcer healing at 12 months in the Band‐aid group compared to the control group?A. 0.64 B. 0.86 C. 1.17 D. 1.56 E. 2.33
What is the relative risk for the leg ulcer healing at 12 months in the control group compared to the Band‐aid group?A. 0.64 B. 0.86 C. 1.17 D. 1.56 E. 2.33
What are the odds for the leg ulcer healing at 12 months in the Band‐aid group?A. 0.64 B. 0.86 C. 1.50 D. 1.56 E. 2.33
What are the odds for the leg ulcer healing at 12 months in the control group?A. 0.64 B. 0.86 C. 1.50 D. 1.56 E. 2.33
Calculate the odds ratio for the leg ulcer healing at 12 months in the Band‐aid group compared to the control group?A. 0.64 B. 0.86 C. 1.17 D. 1.56 E. 2.33
Calculate the odds ratio for the leg ulcer healing at 12 months in the control group compared to the band‐aid group?A. 0.64 B. 0.86 C. 1.17 D. 1.56 E. 2.33
Which ONE of the following statements about probability is INCORRECT?A. If two binary outcomes (X and Y) are mutually exclusive the probability that either X or Y occurs is the sum of the probability that X occurs and the probability that Y occurs.B. If two binary outcomes (X and Y) are
Suppose we toss a single unbiased two‐sided coin three times in a row and record the number of heads. What is the probability of observing a head on three successive tosses?A. 0.500 B. 0.250 C. 0.750 D. 0.125 E. 0.050
Suppose we roll a 10‐sided die (numbered 1 to 10) once.What is the probability of observing a score of 6 or more on this roll?A. 0.4 B. 0.5 C. 0.6 D. 0.7 E. 0.08
Which ONE of the following statements about the Normal distribution is INCORRECT?A. The Normal distribution is symmetrical.B. The peak of the curve lies above the mean.C. The total area under the Normal distribution curve is 1.D. The mean and median will coincide.E. The bigger the variance the
Which (if any) of the following statements about the Normal distribution is CORRECT?A. Approximately 1% of the observations from a Normal distribution lie outside the mean ± 2SD.B. Approximately 2% of the observations from a Normal distribution lie outside the mean ± 2SD.C. Approximately 3% of
Which (if any) of the following statements about the Normal distribution is CORRECT?A. Approximately 1% of the observations from a Normal distribution lie outside the mean ± 1SD.B. Approximately 5% of the observations from a Normal distribution lie outside the mean ± 1SD.C. Approximately 10% of
The systolic blood pressure in the population of middle‐aged people is Normally distributed with a mean of 140 mmHg and a standard deviation of 10.i. What is the approximate probability of having a systolic blood pressure of 120 mmHg or less?A. 0.025 B. 0.05 C. 0.16 D. 0.32 E. 0.95 ii. What
The birthweight of babies in the population is Normally distributed with a mean of 3.5 kg and a standard deviation of 0.5 kg.i. What is the probability of giving birth to a baby weighing more than 3.5 kg?A. 0.025 B. 0.05 C. 0.5 D. 0.75 E. 0.95 ii. What is the approximate probability of giving birth
Which (if any) of the following statements about the standard error is CORRECT?A. The standard error (of the mean) is a measure of the precision of the sample estimate of the mean.B. If we take repeated samples (of the same size) from a population, calculate the sample mean, then the standard
The mean birthweight of a sample of 100 babies is 3500 g with a standard deviation of 500 g. The standard error of the mean birthweight is:A. 25 g B. 50 g C. 100 g D. 500 g E. 3500 g
The mean birthweight of a sample of 25 babies is 3500 g with a standard deviation of 500 g. The standard error of the mean birthweight is:A. 25 g B. 50 g C. 100 g D. 500 g E. 3500 g
Which (if any) of the following statements about a 95% confidence interval for a mean is CORRECT?A. The 95% confidence interval will include the true population mean.B. The 95% confidence interval will include the observed mean.C. If the study were repeated 100 times, of the 100 resulting
The mean birthweight of sample of 100 babies is 3500 g with a standard deviation of 500 g. Thus an approximate 95% confidence interval for the mean birthweight is:A. 3000 to 4000 g B. 3100 to 3900 g C. 3300 to 3700 g D. 3400 to 3600 g E. 3450 to 3550 g
The mean birthweight of sample of 25 babies is 3500 g with a standard deviation of 500 g. Thus an approximate 95% confidence interval for the mean birthweight is:A. 3000 to 4000 g B. 3100 to 3900 g C. 3300 to 3700 g D. 3400 to 3600 g E. 3450 to 3550 g Farndon et al. (2013) report the results of a
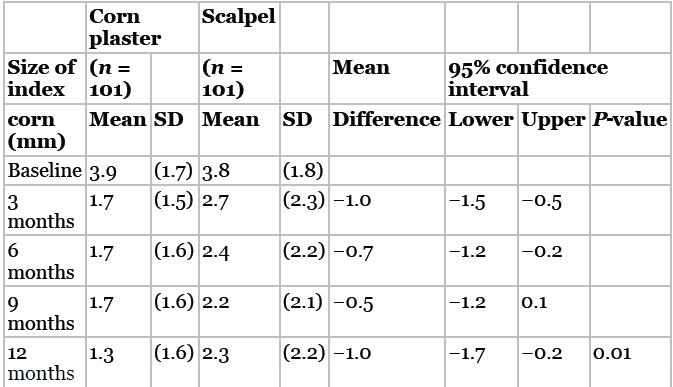
Table 5.5 reports that the 95% confidence interval for the comparison of mean corn size at 12 months between the corn plaster and scalpel groups is: −1.7 to −0.2 mm.Which (if any) of the following statements is CORRECT?A. The above 95% confidence interval definitely contains the true population
Table 5.5 reports that the 95% confidence interval for the comparison of mean corn size at six months between the corn plaster and scalpel groups is: −1.2 to −0.2 mm.Which (if any) of the following statements about the 95% confidence interval is CORRECT?A. There is a probability of 0.05 that
The PREeMPt study (Keen et al. 2018) aimed to investigate whether or not is was feasible to conduct a randomised controlled trial of pretransplant exercise (prehabilitation) in patients with multiple myeloma awaiting autologous haematopoietic stem cell transplantation. One of the feasibility
The PreEMPt study consented and recruited 23 participants in 13 months of recruitment at a single centre, a recruitment rate of 1.8 participants per month.The 95% confidence interval for the monthly recruitment rate is:A. −1.2 to 4.8 B. −0.7 to 4.2 C. 0.5 to 2.0 D. 1.1 to 2.5 E. 1.5 to 2.8
One of the secondary aims of the PreEMPt study was to assess the safety of the prehabilitation exercise programme. A serious adverse event was defined as any adverse event or adverse reaction that results in death, is life‐threatening, required hospitalisation or prolongation of existing
Showing 8500 - 8600
of 8575
First
72
73
74
75
76
77
78
79
80
81
82
83
84
85
86
Step by Step Answers