New Semester Started
Get
50% OFF
Study Help!
--h --m --s
Claim Now
Question Answers
Textbooks
Find textbooks, questions and answers
Oops, something went wrong!
Change your search query and then try again
S
Books
FREE
Study Help
Expert Questions
Accounting
General Management
Mathematics
Finance
Organizational Behaviour
Law
Physics
Operating System
Management Leadership
Sociology
Programming
Marketing
Database
Computer Network
Economics
Textbooks Solutions
Accounting
Managerial Accounting
Management Leadership
Cost Accounting
Statistics
Business Law
Corporate Finance
Finance
Economics
Auditing
Tutors
Online Tutors
Find a Tutor
Hire a Tutor
Become a Tutor
AI Tutor
AI Study Planner
NEW
Sell Books
Search
Search
Sign In
Register
study help
business
dynamic macroeconomics
Macroeconomics 4th Edition Glenn Hubbard, Anthony O'Brien - Solutions
A baseball fan with an Albert Pujols baseball card wants to trade it for a Derek Jeter baseball card, but everyone the fan knows who has a Jeter card doesn’t want a Pujols card.What do economists call the problem this fan is having?
[Related to the Chapter Opener on page 419] An article in the Wall Street Journal in late 2011 notes that“FedEx Corp.’s forecast for record holiday shipping this year shows that U.S. customers are buying more things online.But retailers still anticipate a soft holiday season, with the growth in
In a speech in late 2011, President Barack Obama argued that: “Probably the single greatest cause of the financial crisis and this brutal recession has been the housing bubble that burst four years ago.” What did President Obama mean by the “housing bubble”? How can a housing bubble bring
Explain whether you agree with the following statement:The dynamic aggregate demand and aggregate supply model predicts that a recession caused by a decline in AD will cause the inflation rate to fall. I know that the 2007–2009 recession was caused by a fall in AD, but the inflation rate was not
In the graph below, suppose that the economy moves from point A in year 1 to point B in year 2. Using the graph, briefly explain your answer to each of the questions.a. What is the growth rate in potential real GDP from year 1 to year 2?b. Is the unemployment rate in year 2 higher or lower than in
[Related to Solved Problem 13.4 on page 442] Look at the table in Solved Problem 13.4. The price level for 1974 is given as 30.7, and the price level for 1975 is given as 33.6.The values for the price level are well below 100. Does this indicate that inflation must have been low during these years?
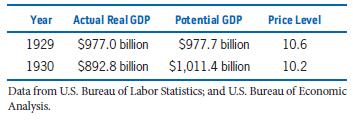
[Related to Solved Problem 13.4 on page 442] Consider the information in the following table for the first two years of the Great Depression (where the values for real GDP and potential GDP are in 2005 dollars):a. The table shows that something happened during 1929–1930 that has not happened
Draw a dynamic aggregate demand and aggregate supply graph showing the economy moving from potential GDP in 2013 to potential GDP in 2014 , with no inflation. Your graph should contain the AD, SRAS, and LRAS curves for both 2013 and 2014 and should indicate the short-run macroeconomic equilibrium
Briefly discuss the factors that brought on the recession of 2007–2009.
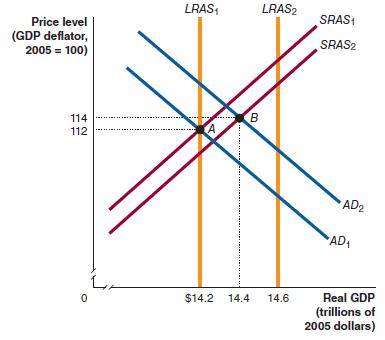
In the dynamic aggregate demand and aggregate supply model, what is the result of aggregate demand increasing more quickly than potential real GDP? What is the result of aggregate demand increasing more slowly than potential real GDP?
[Related to the Making the Connection on page 437]In early 2009, Christina Romer, who was then chair of the Council of Economic Advisers, and Jared Bernstein, who was then an economic adviser to Vice President Joseph Biden, forecast how long they expected it would take for real GDP to return to
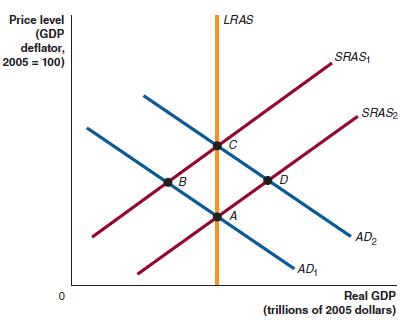
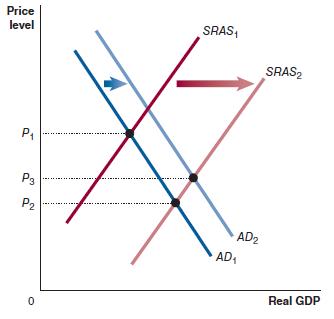
Use the graph on the next page to answer the following questions:a. Which of the points A, B, C, or D can represent a longrun equilibrium?b. Suppose that initially the economy is at point A. If aggregate demand increases from AD1 to AD2, which point represents the economy’s short-run
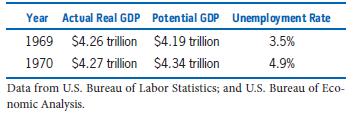
Consider the data in the following table for the years 1969 and 1970 (where the values for real GDP and potential GDP are in 2005 dollarsa. In 1969, actual real GDP was greater than potential real GDP. Explain how this is possible.b. Even though real GDP in 1970 was slightly greater than real GDP
[Related to the Making the Connection on page 434]Edward Leamer of the University of California, Los Angeles, has argued that “housing is the business cycle.” Why would spending on housing be likely to fluctuate more than spending by households on consumer durables, such as automobiles or
List four variables that would cause a decrease in real GDP (if large enough, a recession). Indicate whether changes in each variable increase or decrease aggregate demand or short-run aggregate supply. Next, state four variables that would cause an increase in the price level(short-run inflation).
Draw a basic aggregate demand and aggregate supply graph (with LRAS constant) that shows the economy in long-run equilibrium.a. Assume that there is a large increase in demand for U.S.exports. Show the resulting short-run equilibrium on your graph. In this short-run equilibrium, is the unemployment
Why are the long-run effects of an increase in aggregate demand on price and output different from the short-run effects?
What is the relationship among the AD, SRAS, and LRAS curves when the economy is in long-run macroeconomic equilibrium?
What are menu costs? How has the widespread use of computers and the Internet affected menu costs? If menu costs were eliminated, would the short-run aggregate supply curve be a vertical line? Briefly explain.
Workers and firms often enter into contracts that fix prices or wages, sometimes for years at a time. If the price level turns out to be higher or lower than was expected when the contract was signed, one party to the contract will lose out. Briefly explain why, despite knowing this, workers and
Suppose that workers and firms could always predict next year’s price level with perfect accuracy. Briefly explain whether in these circumstances the SRAS curve would still slope upward.
Explain how each of the following events would affect the short-run aggregate supply curve.a. An increase in the price levelb. An increase in what the price level is expected to be in the futurec. A price level that is currently higher than expectedd. An unexpected increase in the price of an
An article in the Economist magazine noted that “the economy’s potential to supply goods and services [is] determined by such things as the labour force and capital stock, as well as inflation expectations.” Do you agree with this list of the determinants of potential GDP? Briefly
[Related to the Making the Connection on page 426] If real GDP in the United States declined by more during the 2007–2009 recession than did real GDP in Canada, China, and other trading partners of the United States, would the effect be to increase or decrease U.S. net exports? Briefly explain.
[Related to Solved Problem 13.1 on page 423] Explain whether each of the following will cause a shift of the AD curve or a movement along the AD curve.a. Firms become more optimistic and increase their spending on machinery and equipment.b. The federal government increases taxes in an attempt to
[Related to the Don’t Let This Happen to You on page 423]A student was asked to draw an aggregate demand and aggregate supply graph to illustrate the effect of an increase in aggregate supply. The student drew the following graph:The student explains the graph as follows:An increase in aggregate
Explain how each of the following events would affect the aggregate demand curve.a. An increase in the price levelb. An increase in government purchasesc. Higher state income taxesd. Higher interest ratese. Faster income growth in other countries
What variables cause the AD curve to shift? For each variable, identify whether an increase in that variable will cause the AD curve to shift to the right or to the left.
What relationship is shown by the aggregate demand curve? What relationship is shown by the aggregate supply curve?
Suppose that autonomous consumption is 500, government purchases are 1,000, planned investment spending is 1,250, net exports are −250, and the MPC is 0.8. What is equilibrium GDP?
For the macroeconomic model in problem 12A.2, write the aggregate expenditure function. For GDP of $16,000, what is the value of aggregate expenditure, and what is the value of the unintended change in inventories? For GDP of $12,000, what is the value of aggregate expenditure, and what is the
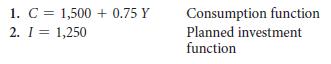
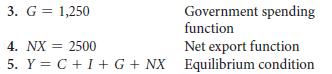
Find equilibrium GDP using the following macroeconomic model (where the numbers, with the exception of the MPC, represent billions of dollars). 1. C1,500 + 0.75 Y 2. I = 1,250 Consumption function Planned investment function
Write a general expression for the aggregate expenditure function. If you think of the aggregate expenditure function as a line on the 45°-line diagram, what would be the intercept and what would be the slope, using the general values represented by letters?
Briefly explain whether you agree with the following statement:“The reason the aggregate demand curve slopes downward is that when the price level is higher, people cannot afford to buy as many goods and services.”
Briefly explain why the aggregate expenditure line is upward sloping, while the aggregate demand curve is downward sloping.
Briefly explain which components of aggregate expenditure are affected by a change in the price level.
Briefly explain the difference between aggregate expenditure and aggregate demand.
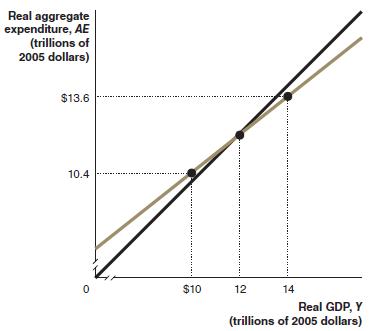
Use the following graph to answer the questions.a. What is the value of equilibrium real GDP?b. What is the value of the MPC?c. What is the value of the multiplier?d. What is the value of unplanned changes in inventories when real GDP has each of the following values?• $10 trillion • $12
Suppose booming economies in the BRIC nations (Brazil, Russia, India, and China) causes net exports to rise by $75 billion in the United States. If the MPC is 0.8, what will be the change in equilibrium GDP?
Explain whether you agree with the following statement:Some economists claim that the recession of 2007–2009 was caused by a decline in spending on residential construction. This can’t be true. If there had just been a decline in spending on residential construction, the only firms hurt would
Explain whether each of the following would cause the value of the multiplier to be larger or smaller.a. An increase in real GDP increases imports.b. An increase in real GDP increases interest rates.c. An increase in in real GDP increases the marginal propensity to consume.d. An increase in real
If the marginal propensity to consume is 0.75, by how much will an increase in planned investment spending of$400 billion shift up the aggregate expenditure line? By how much will it increase equilibrium real GDP?
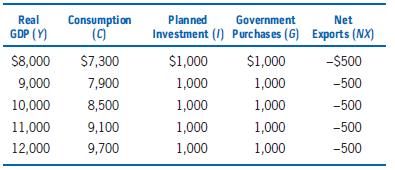
[Related to Solved Problem 12.4 on page 404.] Use the information in the following table to answer the following questions.Assume that the values represent billions of 2005 dollarsa. What is the equilibrium level of real GDP?b. What is the MPC?c. Suppose net exports increase by $400 billion. What
[Related to the Making the Connection on page 401.] If the multiplier had a value of 4 in 1929, how large must the change in autonomous expenditure have been to cause the decline in real GDP between 1929 and 1933 shown in the table on page 401? If the multiplier had a value of 2, how large must the
In Figure 12.12 on page 399, the economy is initially in equilibrium at point A. Aggregate expenditure and real GDP both equal $9.6 trillion. The increase in investment of $100 billion increases aggregate expenditure to $9.7 trillion.If real GDP increases to $9.7 trillion, will the economy be in
What is the multiplier effect? Use a 45°-line diagram to illustrate the multiplier effect of a decrease in government purchases.
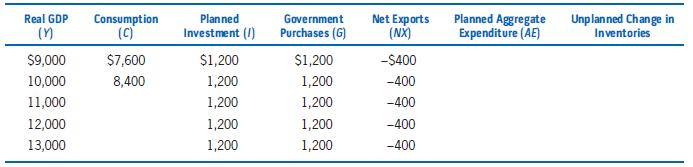
[Related to Solved Problem 12.3 on page 398] Fill in the missing values in the following table. Assume that the value of the MPC does not change as real GDP changes. Also assume that the values represent billions of 2005 dollars.a. What is the value of the MPC?b. What is the value of equilibrium
[Related to the Don’t Let This Happen to You on page 397]Briefly explain whether you agree with the following argument:“The equilibrium level of GDP is determined by the level of aggregate expenditure. Therefore, GDP will decline only if households decide to spend less on goods and services.”
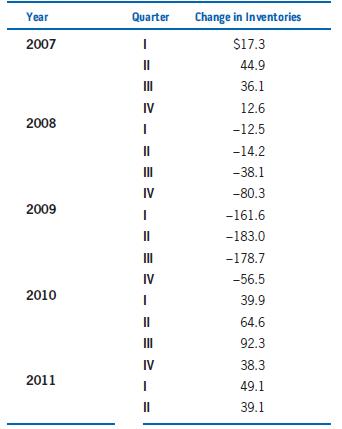
Consider the following table, which shows the change in inventories for each quarter from 2007:I to 2011:II measured in billions of 2005 dollars. Provide a macroeconomic explanation for this pattern. (Hint: When did the recession during this period begin and end?) Year Quarter Change in Inventories
Jack Lavery, former chief economist at Merrill Lynch, made the following observation about the U.S. economy in April 2009: “I expect inventory drawdown to be even more pronounced in the second quarter, which will contribute to the fourth successive quarterly decline in real GDP.” What does
A Federal Reserve Board publication makes the following observation: “The impact of inventory increases on the business cycle depends upon whether [the increases] are planned or unplanned.” Do you agree? Briefly explain.
What is the macroeconomic consequence if firms accumulate large amounts of unplanned inventory at the beginning of a recession?
Use a 45°-line diagram to illustrate macroeconomic equilibrium.Make sure your diagram shows the aggregate expenditure function and the level of equilibrium real GDP and that your axes are properly labeled.
[Related to the Making the Connection on page 388]We saw that Intel hopes to increase sales of microprocessors used in cell phones and other small consumer electronics products. During a recession, why would spending on these products be more stable than spending on computers?
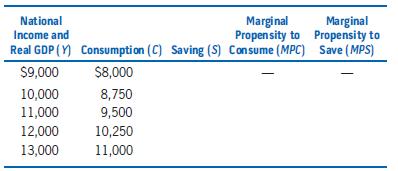
[Related to Solved Problem 12.2 on page 386] Fill in the blanks in the following table. Assume for simplicity that taxes are zero. Also assume that the values represent billions of 2005 dollars. National Income and Marginal Propensity to Marginal Propensity to Save (MPS) Real GDP (Y) Consumption
Unemployed workers receive unemployment insurance payments from the government. Does the existence of unemployment insurance make it likely that consumption will fluctuate more or fluctuate less over the business cycle than it would in the absence of unemployment insurance?Briefly explain.
[Related to the Making the Connection on page 381]Writing about the state of the British economy, an article in the Economist argued: “Spending will be hit . . . by weak stock-markets and shrinking housing wealth.” Would Calomiris, Longhofer, and Miles agree with this argument?Would Mian and
An economics student raises the following objection:“The textbook said that a higher interest rate lowers investment, but this doesn’t make sense. I know that if I can get a higher interest rate, I am certainly going to invest more in my savings account.” Do you agree with this reasoning?
Many people have difficulty borrowing as much money as they want to, even if they are confident that their incomes in the future will be high enough to easily pay back the borrowed funds. For example, many students in medical school will earn high incomes after they graduate and become physicians.
Draw the consumption function and label each axis.Show the effect of an increase in income on consumption spending. Does the change in income cause a movement along the consumption function or a shift of the consumption function? How would an increase in expected future income or an increase in
[Related to the Chapter Opener on page 375] Suppose a major U.S. furniture manufacturer is forecasting demand for its products during the next year. How will the forecast be affected by each of the following?a. A survey shows a sharp rise in consumer confidence that income growth will be
Compare what happened to real investment between 1979 and the second quarter of 2011 with what happened to real consumption during that period.
Give an example of each of the four categories of aggregate expenditure.
A survey conducted by the Institute for Supply Management in June 2011 showed a significant increase in inventories in manufacturing.An analyst for the investment bank Goldman Sachs commented that the increase in inventories was “a negative for future activity.” Why might an increase in
In the first quarter of 2011, business inventories increased by $49.1 billion. Can we tell from this information whether aggregate expenditure was higher or lower than GDP during the first quarter of 2011? If not, what other information do we need?Data from Bureau of Economic Analysis.
Suppose Apple plans to produce 20.2 million iPhones this year. The company expects to sell 20.1 million and add 100,000 to the inventories in its stores.a. Suppose that at the end of the year, Apple has sold 19.9 million iPhones. What was Apple’s planned investment?What was Apple’s actual
Into which category of aggregate expenditure would each of the following transactions fall?a. The Jones family buys a new car.b. The San Diego Unified School District buys 12 new school buses.c. The Jones family buys a newly constructed house from the Garcia Construction Co.d. A consumer in Japan
Which of the following does the aggregate expenditure model seek to explain: long-run economic growth, the business cycle, inflation, and cyclical unemployment?
What is the main reason for changes in GDP in the short run?
More people in high-income countries than in low-income countries tend to believe that rapid rates of economic growth are not desirable. Recall the concept of a “normal good” from Chapter 3. Does this concept provide insight into why some people in high-income countries might be more concerned
Economist George Ayittey, in an interview on PBS about economic development in Africa, stated that of the 54 African countries, only 8 had a free press. For Africa’s economic development, Ayittey argued strongly for the establishment of a free press. Why would a free press be vital for the
Is it likely to be easier for the typical developing country to improve the state of public health or to improve the average level of education? Briefly explain.
[Related to the Making the Connection on page 361] In China, why may a lower birthrate lead to slower growth in real GDP per capita? Why might high levels of spending on investment in China lead to high rates of growth in the short run, but not in the long run?
[Related to the Chapter Opener on page 337] In discussing the future of China, the Economist magazine observed:And there are . . . clear limits to the march of freedom in China; although personal and economic freedoms have multiplied, political freedoms have been disappointingly constrained since
Can economics arrive at the conclusion that economic growth will always improve economic well-being? Briefly explain.
The Roman Empire lasted from 27 b.c. to 476 a.d. The empire was wealthy enough to build such monuments as the Roman Coliseum. Roman engineering skill was at a level high enough that aqueducts built during the empire to carry water long distances remained in use for hundreds of years. Yet the
A columnist in the New York Times observes that, “many analysts agree that economic reform, of which integration into the global economy was a key element, has lifted millions of people out of poverty in India. What does “integration into the global economy” mean? How might integration into
In a speech in 2009, President Barack Obama made the following observations: “I know that for many, the face of globalization is contradictory. . . . Trade can bring new wealth and opportunities, but also huge disruptions and change in communities.” How does trade bring “new wealth and
[Related to the Making the Connection on page 358]The relationship that Raymond Fisman and Edward Miguel found between the extent of corruption in a country and the number of parking violations committed by the country’s United Nations delegates in New York isn’t perfect. For example,
An opinion column in the Economist argued, “Globalisation, far from being the greatest cause of poverty, is its only feasible cure.” What does globalization have to do with reducing poverty?From Clive Crook, “Globalisation and Its Critics,” Economist, September 27, 2001.
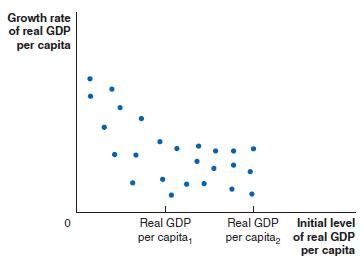
[Related to Solved Problem 11.4 on page 354] In the following figure, each dot represents a country, with its initial real GDP per capita and its growth rate of real GDP per capita.a. For the range of initial GDP per capita from 0 to Real GDP per capita2, does the figure support the economic growth
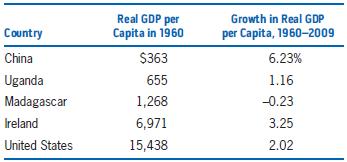
[Related to Solved Problem 11.4 on page 354] Briefly explain whether the statistics in the following table are consistent with the economic growth model’s predictions of catch-up. Country Real GDP per Capita in 1960 Growth in Real GDP per Capita, 1960-2009 China $363 6.23% Uganda 655 1.16
In what ways does the United States have greater flexibility in its labor markets and greater efficiency in its financial system than other higher income countries such as those in Europe? How might this greater flexibility in labor markets and greater efficiency in financial markets lead to higher
Why does the economic growth model predict that poor countries should catch up to rich countries in income per capita? Have poor countries been catching up to rich countries?
Economist Robert Gordon of Northwestern University has argued that:My interpretation of the [information] revolution is that it is increasingly burdened by diminishing returns. The push to ever smaller devices runs up against the fixed size of the human finger that must enter information on the
An article in the Wall Street Journal observes: “For 2008, productivity grew an astounding 2.8% from 2007 even as the economy suffered through its worst recession in decades.”How is it possible for labor productivity—output per hour worked—to increase if output—real GDP—is falling?From
Figure 11.5 on page 350 shows growth rates in real GDP per hour worked in the United States for various periods from 1900 onward. How might the growth rates in the figure be different if they were calculated for real GDP per capita instead of per hour worked? (Hint: How do you think the number of
Why do some economists believe that the higher productivity growth rates that began in the mid-1990s can be sustained?
Describe the record of productivity growth in the United States from 1800 to the present. What explains the slowdown in productivity growth from the mid-1970s to the mid-1990s? Why did productivity growth increase beginning in 1995?
[Related to the Making the Connection on page 346]The Making the Connection argues that a key difference between market economies and centrally planned economies, like that of the former Soviet Union, is as follows:In market economies, decisions about which investments to make and which
Why is the role of the entrepreneur much more important in the new growth theory than in the traditional economic growth model?
[Related to Solved Problem 11.2 on page 347] Shortly before the fall of the Soviet Union, the economist Gur Ofer of Hebrew University of Jerusalem, wrote this: “The most outstanding characteristic of Soviet growth strategy is its consistent policy of very high rates of investment, leading to a
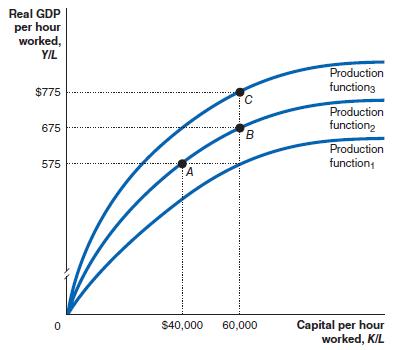
[Related to Solved Problem 11.2 on page 347] Use the graph at the top of the next column. to answer the following questions.a. True or false: The movement from point A to point B shows the effects of technological change.b. True or false: The economy can move from point B to point C only if there
Which of the following will result in a movement along China’s per-worker production function, and which will result in a shift of China’s per-worker production function?Briefly explain.a. Capital per hour worked increases from 5 million yuan per hour worked to 6 million yuan per hour worked.b.
According to a study by an economist at the Federal Reserve Bank of Minneapolis, during the mid-1980s, managers at iron mines in Canada and the United States increased output per hour worked by 100 percent through changes in work rules that increased workers’ effort per hour worked and increased
Why are firms likely to underinvest in research and development, which slows the accumulation of knowledge capital, slowing economic growth? Briefly discuss three ways in which government policy can increase the accumulation of knowledge capital.
Using the per-worker production function graph from Figures 11.3 and 11.4 on pages 344–345, show the effect on real GDP per hour worked of an increase in capital per hour worked, holding technology constant. Now, again using the per-worker production function graph, show the effect on real GDP
[Related to the Making the Connection on page 342]Economist Charles Kenny of the World Bank has argued that:The process technologies—institutions like laws and inventory management systems—that appear central to raising incomes per capita flow less like water and more like bricks.But ideas and
[Related to the Making the Connection on page 342] In his book The White Man’s Burden, William Easterly reports that A vaccination campaign in southern Africa virtually eliminated measles as a killer of children. Routine childhood immunization combined with measles vaccination in seven southern
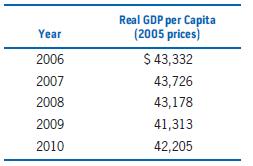
[Related to the Don’t Let This Happen to You on page 341]Use the data for the United States in this table to answer the following questions:a. What was the percentage change in real GDP per capita between 2006 and 2010?b. What was the average annual growth rate in real GDP per capita between 2006
Showing 2600 - 2700
of 5072
First
20
21
22
23
24
25
26
27
28
29
30
31
32
33
34
Last
Step by Step Answers