New Semester
Started
Get
50% OFF
Study Help!
--h --m --s
Claim Now
Question Answers
Textbooks
Find textbooks, questions and answers
Oops, something went wrong!
Change your search query and then try again
S
Books
FREE
Study Help
Expert Questions
Accounting
General Management
Mathematics
Finance
Organizational Behaviour
Law
Physics
Operating System
Management Leadership
Sociology
Programming
Marketing
Database
Computer Network
Economics
Textbooks Solutions
Accounting
Managerial Accounting
Management Leadership
Cost Accounting
Statistics
Business Law
Corporate Finance
Finance
Economics
Auditing
Tutors
Online Tutors
Find a Tutor
Hire a Tutor
Become a Tutor
AI Tutor
AI Study Planner
NEW
Sell Books
Search
Search
Sign In
Register
study help
business
essential statistics
Elementary Statistics 3rd International Edition William Navidi, Barry Monk - Solutions
Why do large values of ????2 provide evidence against H0? Why don’t small values of ????2 provide evidence against H0?
Can’t read the numbers: Because of printer failure, none of the observed frequencies in the following table were printed, but some of the row and column totals were. Is it possible to construct the corresponding table of expected frequencies from the information given? If so, construct it. If
State a conclusion: Can you conclude that the distribution of outcomes differs among the hospitals? Use the ???? = 0.05 level of significance.
Test statistic: Compute the value of the chi-square statistic.
Expected frequencies: Compute the expected frequencies under the null hypothesis of homogeneity.
State a conclusion: Can you conclude that the quality varies among shifts? Use the ???? = 0.01 level of significance.
Test statistic: Compute the value of the chi-square statistic.
Expected frequencies: Compute the expected frequencies under the null hypothesis of homogeneity.
State a conclusion: Can you conclude that education level is independent of gender? Use the ???? = 0.01 level of significance.
Test statistic: Compute the value of the chi-square statistic.
Expected frequencies: Compute the expected frequencies under the null hypothesis of independence.
State a conclusion: Can you conclude that the distribution of boys differs from the binomial with p = 0.5? Use the???? = 0.05 level of significance.
Expected frequencies: Compute the expected frequencies.
Null hypothesis: Let p0 be the probability that a family with four children has no boys, p1 be the probability that a family has one boy, and so on. The null hypothesis is that the number of boys in a four-child family follows a binomial distribution with n = 4 and p = 0.5. State the null
Several null hypotheses are tested, and one of them is rejected after the Bonferroni adjustment. Explain why this null hypothesis would also have been rejected if it had been the only one tested.
Meeting specifications: Two extrusion machines that manufacture steel rods are being compared. In a sample of 1000 rods taken from machine A, 960 met specifications regarding length and diameter. In a sample of 600 rods taken from machine B, 582 met the specifications. Machine B is more expensive
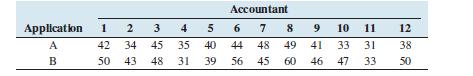
Spreadsheets: An accounting firm tested two spreadsheet applications to determine whether there is a difference between them in the mean speed with which a standard accounting problem can be solved. The times needed for each of twelve accountants to solve the problem are as follows:Can you conclude
Watching television: The General Social Survey reported that in a sample of 68 men aged 18–25, the mean number of hours of television watched per day was 2.76 with a standard deviation of 2.21. In a sample of 72 women aged 18–25, the mean number of hours of television watched per day was 2.88
Exercise: Medical researchers conducted a study to determine whether treadmill exercise could improve the walking ability of patients suffering from claudication, which is pain caused by insufficient blood flow to the muscles of the legs. A sample of 8 patients walked on a treadmill for six minutes
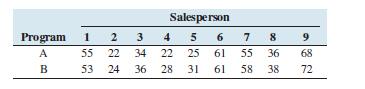
Sales commissions: A company studied two programs for compensating its sales staff. Nine salespeople participated in the study. In program A, salespeople were paid a higher salary, plus a small commission for each item they sold. In program B, they were paid a lower salary with a larger commission.
Contaminated water: The concentration of benzene was measured in units of milligrams per liter for a simple random sample of five specimens of untreated wastewater produced at a gas field. The sample mean was 7.8 with a sample standard deviation of 1.4. Seven specimens of treated wastewater had an
Political polling: In a certain state, a referendum is being held to determine whether the transportation authority should issue additional highway bonds. A sample of 500 voters is taken in county A, and 285 say that they favor the bond proposal. A sample of 600 voters is taken in county B, and 305
Sick days: A large company is considering a policy of flextime, in which employees can choose their own work schedules within broad limits. The company is interested to determine whether this policy would reduce the number of sick days taken. They chose two simple random samples of 100 employees
Five null hypotheses were tested, and the P-values were 0.24, 0.17, 0.03, 0.002, and 0.02. How many of the hypotheses are rejected at the ???? = 0.05 level if the Bonferroni adjustment is made?
Can you reject H0 at the ???? = 0.05 level? State a conclusion.
Refer to Exercise
Compute the value of the test statistic.
Refer to Exercise
A simple random sample of 17 business majors from a certain university had a mean GPA of 2.81 with a standard deviation of 0.27. A simple random sample of 23 psychology majors was selected from the same university, and their mean GPA was 2.97 with a standard deviation of 0.23. Boxplots show that it
Can you reject H0 at the ???? = 0.01 level? State a conclusion.
Refer to Exercise
Compute the value of the test statistic.
Refer to Exercise
Two suppliers of machine parts delivered large shipments. A simple random sample of 150 parts was chosen from each shipment.For supplier A, 12 of the 150 parts were defective. For supplier B, 28 of the 150 parts were defective. The question of interest is whether the proportion of defective parts
Can you reject H0 at the ???? = 0.05 level?
Find the value of the test statistic for testing H0: ????d = 15 versus H1: ????d >
In a set of 12 matched pairs, the mean difference was d̄ = 18 and the standard deviation of the differences was sd =
How many degrees of freedom are there for the test statistic? Use the simple method.
For a test of H0: ????1 = ????2 versus H1: ????1 ≠ ????2, the sample sizes were n1 = 15 and n2 =
A sample of size 15 is drawn from a normal population. The sample standard deviation is s1 = 5.2. A sample of size 10 is drawn from another normal population. The sample standard deviation is s2 = 9.3. Can you conclude that the variances of these two populations are different? Use the ???? = 0.05
In a test of H0: p1 = p2 versus H1: p1 ≠ p2, the value of the test statistic is z = −1.21. What do you conclude about the difference p1 − p2 at the ???? = 0.05 level of significance?
A simple random sample of 75 people are given a new drug that is designed to relieve pain. After taking this drug for a month, they switch to a standard drug. The question of interest is whether the proportion of people who experienced relief is greater when taking the new drug. To address this
A fleet of 100 taxis is divided into two groups of 50 cars each to determine whether premium gasoline reduces maintenance costs. Premium unleaded fuel is used in group A, while regular unleaded fuel is used in group B. The total maintenance cost for each vehicle during a one-year period is
Two machines are used to fill cans. The machines are supposed to fill each can with 12 ounces of liquid. The amounts actually filled follow a normal distribution. A simple random sample of 10 cans is filled by each machine. The question of interest is whether the variability in the fill volume
A simple random sample of 75 people are given a new drug that is designed to relieve pain. A second sample of 50 people are given a standard drug. The question of interest is whether the proportion of people experiencing relief is greater among those taking the new drug. To address this question,
Provide an example of two samples that are paired. Explain why these samples are paired.
Provide an example of two samples that are independent. Explain why these samples are independent.
In what ways is the procedure for constructing a confidence interval for the difference between two proportions similar to constructing a confidence interval for one proportion? In what ways is it different?
Why is it necessary for all values in the confidence interval to be positive to conclude that ????1 > ????2? What would have to be true to conclude that ????1 < ????2?
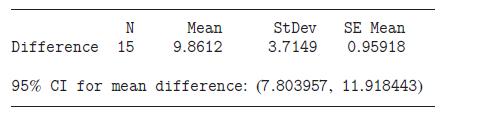
Interpret computer output: The following output from MINITAB presents a confidence interval for the mean difference between matched pairs.a. Find the point estimate of ????d.b. How many degrees of freedom are there?c. Fill in the blanks: We are confident that the mean difference is between and . N
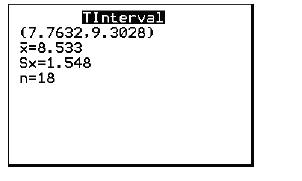
Interpret calculator display: The following TI-84 Plus calculator display presents a 95% confidence interval for the mean difference between matched pairs.a. Find the point estimate of ????d.b. How many degrees of freedom are there?c. Fill in the blanks: We are 95% confident that the mean
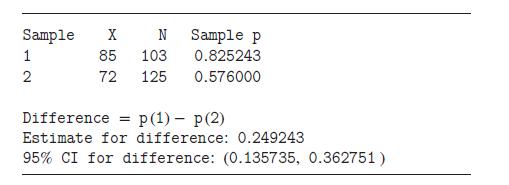
Interpret computer output: The following MINITAB output presents a confidence interval for the difference between two proportions.a. Find the point estimate of p1 − p2.b. Fill in the blanks: We are confident that the difference between the proportions is between and . Sample X N 1 85 103 Sample p
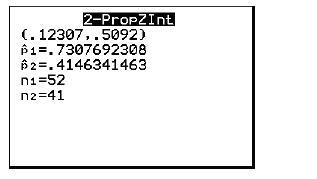
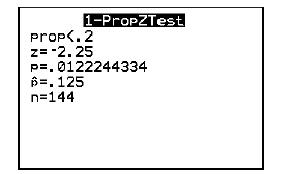
Interpret calculator display: The following TI-84 Plus calculator display presents a 95% confidence interval for the difference between two proportions.a. Find the point estimate of p1 − p2.b. Fill in the blanks: We are 95% confident that the difference between the proportions is between and .
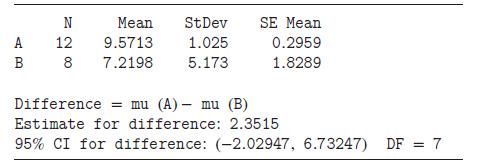
Interpret computer output: The following MINITAB output display presents a 95% confidence interval for the difference between two means.a. Find the point estimate of ????1 − ????2.b. How many degrees of freedom did MINITAB use?c. Fill in the blanks: We are confident that the difference between
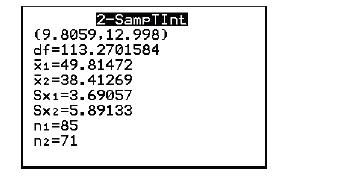
Interpret calculator display: The following TI-84 Plus calculator display presents a 95% confidence interval for the difference between two means. The sample sizes are n1 = 85 and n2 = 71.a. Find the point estimate of ????1 − ????2.b. How many degrees of freedom did the calculator use?c. Fill in
Automobile pollution: In a random sample of 340 cars driven at low altitudes, 46 exceeded a threshold for the amount of particulate pollution. In a random sample of 85 cars driven at high altitudes, 21 exceeded a threshold for the amount of particulate pollution. Construct a 99% confidence interval
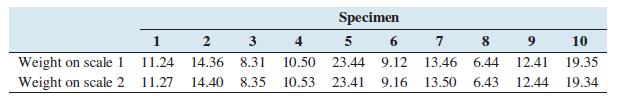
Dueling scales: In an experiment to determine whether there is a systematic difference between the weights obtained with two different scales, 10 rock specimens were weighed, in grams, on each scale. The following data were obtained:Construct a 98% confidence interval for mean difference in weight
Treating bean plants: In a study to measure the effect of an herbicide on the phosphate content of bean plants, a sample of 75 plants treated with the herbicide had a mean phosphate concentration (in percent) of 3.52 with a standard deviation of 0.41, and 100 untreated plants had a mean phosphate
Polling results: A simple random sample of 400 voters in the town of East Overshoe was polled, and 242 said they planned to vote in favor of a bond issue to raise money for elementary schools. A simple random sample of 300 voters in West Overshoe was polled, and 161 said they were in favor.
Recovery time from surgery: A new postsurgical treatment is being compared with a standard treatment. Seven subjects receive the new treatment, while seven others (the controls) receive the standard treatment. The recovery times, in days, are given below.Control: 18 23 24 30 32 35 39 Treatment: 12
College tuition: Independent random samples of private college and university tuition and fees for the 2012–2013 academic year from California and New York yielded the following data, in dollars.Construct a 95% confidence interval for the difference between the mean amounts of tuition in the two
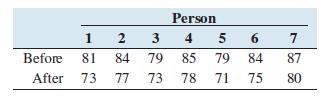
Exercise and heart rate: A simple random sample of seven people embarked on a program of regular aerobic exercise.Their heart rates, in beats per minute, were measured before and after, with the following results:Construct a 95% confidence interval for the mean reduction in heart rate. Person 1 2 3
Don’t construct a confidence interval: An investor is trying to decide in which of two stocks to invest. He examines records for the past 365 days, and finds that the price of stock A increased on 197 of them and the price of stock B increased on 158 of them. Explain why these data should not be
Hatching shrimp eggs: A study of the effect of water pollution on the habitat of shrimp reported that out of 1985 eggs produced by shrimp at the Diesel Creek site in Charleston, South Carolina, 1919 hatched, and at the Shipyard Creek site, also in Charleston, 4561 out of 4988 eggs hatched.
In a poll of 100 voters, 57 said they were planning to vote for the incumbent governor, and 48 said they were planning to vote for the incumbent mayor. Explain why these data should not be used to construct a confidence interval for the difference between the proportions of voters who plan to vote
Construct a 90% confidence interval for the difference ????1 − ????2.
Refer to Exercise
Compute the margin of error for a 90% confidence interval for the difference????1 − ????2.
Refer to Exercise
Find the critical value for a 90% confidence interval for the difference ????1 − ????2.
Refer to Exercise
A random sample of 76 residents in a small town had a mean annual income of $34,214, with a sample standard deviation of $2171. In a neighboring town, a random sample of 88 residents had a mean annual income of $31,671 with a sample standard deviation of $3279. Let ????1 be the population mean
Construct a 99% confidence interval for the difference ????d.
Refer to Exercise
Compute the margin of error for a 99% confidence interval for the difference ????d.
Refer to Exercise
Find the critical value for a 99% confidence interval for ????d.
Refer to Exercise
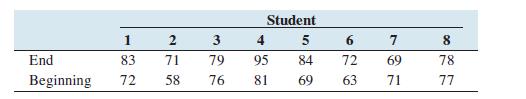
Eight students in a particular college course are given a pre-test at the beginning of the semester and are then given the same exam at the end to test what they have learned. The exam scores at the beginning and at the end are given in the following table.Let ????d be the mean difference End −
Refer to Exercise 3.Construct a 95% confidence interval for the difference p1 − p2.
Refer to Exercise 3.Compute the margin of error for a 95% confidence interval for the difference p1 − p2.
Find the critical value for a 95% confidence interval for the difference p1 − p2.
Refer to Exercise
In a survey of 300 randomly selected female and 240 male holiday shoppers, 87 of the females and 98 of the males stated that they will wait until the last week before Christmas to finish buying gifts. Let p1 be the population proportion of males who will wait until the last week and let p2 be the
A sample of 20 weight lifters is tested to see how much weight they can bench press. Ten of them are chosen at random as the treatment group. They participate in a special training program for three weeks. The remaining 10 are the control group. They follow their usual program. At the end of three
A sample of 15 weight lifters is tested to see how much weight they can bench press. They then follow a special training program for three weeks, after which they are tested again. The samples are the amounts of weights that were lifted before and after the training program.
Explain why the power will be greater when the true value of ???? is 20 than when the true value of ???? is 15.
A test will be made of H0: ???? = 12 versus H1: ???? >
In what ways are hypothesis tests for a population mean different from hypothesis tests for a proportion? In what ways are they similar?
Why don’t we need to know the population standard deviation when performing a test about a population proportion?
Why is it important to report the P-value or the test statistic when presenting the results of a hypothesis test?
What does the P-value represent?
A result is significant at the 0.01 level. Explain why it must also be significant at the 0.05 level.
What’s the news? The Pew Research Center reported that 23% of 18- to 29-year-olds watch a cable news channel regularly. The director of media relations at a large university wants to know whether the population proportion of cable news viewers among students at her university is greater than the
How much rent? A housing official in a certain city claims that the mean monthly rent for apartments in the city is more than $1000. To verify this claim, a simple random sample of 40 renters in the city was taken, and the sample mean rent paid was $1100 with a sample standard deviation of $300.
Crackers: Boxes of crackers are filled by a machine. The weights of a random sample of 25 boxes of crackers have standard deviation s = 5 grams. Assume the weights are normally distributed. Can you conclude that the population standard deviation is less than 10 grams? Use the ???? = 0.05 level of
How many TV sets? A survey organization sampled 60 households in a community and found that the sample mean number of TV sets per household was 3.1. The population standard deviation is ???? = 1.5. Can you conclude that the mean number of TV sets per household is greater than 3?a. State the null
Interpret calculator display: The following TI-84 Plus display presents the results of a hypothesis test.a. Is this a test for a mean, a proportion, or a standard deviation?b. What are the null and alternate hypotheses?c. What is the value of the test statistic?d. What is the P-value?e. Do you
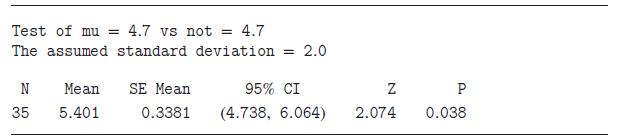
Interpret computer output: The following output from MINITAB presents the results of a hypothesis test.a. What are the null and alternate hypotheses?b. What is the value of the test statistic?c. What is the P-value?d. Do you reject H0 at the ???? = 0.05 level?e. Do you reject H0 at the ???? = 0.01
Can you conclude that the population standard deviation is greater than 2? Use the ???? = 0.01 level of significance.
Showing 2000 - 2100
of 2398
First
10
11
12
13
14
15
16
17
18
19
20
21
22
23
24
Step by Step Answers