New Semester
Started
Get
50% OFF
Study Help!
--h --m --s
Claim Now
Question Answers
Textbooks
Find textbooks, questions and answers
Oops, something went wrong!
Change your search query and then try again
S
Books
FREE
Study Help
Expert Questions
Accounting
General Management
Mathematics
Finance
Organizational Behaviour
Law
Physics
Operating System
Management Leadership
Sociology
Programming
Marketing
Database
Computer Network
Economics
Textbooks Solutions
Accounting
Managerial Accounting
Management Leadership
Cost Accounting
Statistics
Business Law
Corporate Finance
Finance
Economics
Auditing
Tutors
Online Tutors
Find a Tutor
Hire a Tutor
Become a Tutor
AI Tutor
AI Study Planner
NEW
Sell Books
Search
Search
Sign In
Register
study help
business
essential statistics
Statistics Data Analysis And Decision Modeling 5th International Edition James R. Evans - Solutions
35. Using the data on excel file Census Education data, construct the probability distribution for race and educational status.a. What is the probability that a person is white and has a bachelor’s degree?b. What is the probability that someone known to have an associate’s degree is black?c.
34. Using the data on excel file Census Education data , construct the probability distribution for race and educational status.a. What is the probability that a person is white and has a bachelor’s degree?b. What is the probability that someone known to have an associate’s degree is black?c.
33. The length of time between arrivals of cars in a highways tollbooth is exponentially distributed with a mean of 45 seconds.a. What is the probability that an arrival time will be greater than a minute?b. What proportion of arrivals will be in less than 30 seconds?
32. The amount of time (in seconds) spent by bees in a certain flower patch is exponential with a mean of 90.What is the probability that a particular bee will take more than 100 seconds to collect honey?
31. Compute the expected values and the variance for each of the parameter sets of the triangular distribution.a. a = 0, b = 4, c = 2b. a = 0, b = 4, c = 3c. a = 0, b = 4, c = 1
30. It is known that people who buy lottery tickets regularly spend approximately $30 a month on them, with a standard deviation of $5. Find the probability that such a person will spend at least $20 per month on lottery tickets. If 100 individuals who buy lottery tickets regularly are sampled,
29. The weight of a particular chip in the manufacturing process of a certain notepad computer must be between 40 and 50 grams. It is known that the standard deviation of the weight of the chip, which is normally distributed, is 3 grams.a. If the actual mean weight is 45 grams, what proportion of
28. The specifications of a particular component in a manufacturing process requires that the length of the component be 25 mm. Due to the variation in the manufacturing process the components actually have a mean of 25 mm, a standard deviation of 2 mm and are normally distributed.a. If the length
27. The weight of high school boys in a certain city is normally distributed, with mean m = 50 kg and standard deviation s = 4 kg. Find the probability that an individual student’s weight isa. Less than 45 kg.b. Between 48 and 51 kg.c. Greater than 63 kg.
26. The birth weight X (in grams) of babies in the United States is normally distributed with a mean of 3315 and standard deviation of 575. Find the following:a. P(X 6 3890)b. P(2740 6 X)c. P(2165 6 X 6 4465)d. The birth weight that the upper 5% of babies achieve.
25. The minimum volume of a regular can of soda is 10 ounces. It is also known that 60% of the volume of similar cans is less than 13 ounces. If the volume of the cans is uniformly distributed, what will be the parameters of the distribution?
24. The weight of a box of pasta in a production process is uniformly distributed between 280 and 320 grams.a. Find the expected value and the variance of the weight of the pasta boxes.b. What is the probability that a randomly chosen box of pasta will weigh less than 290 grams?c. What is the
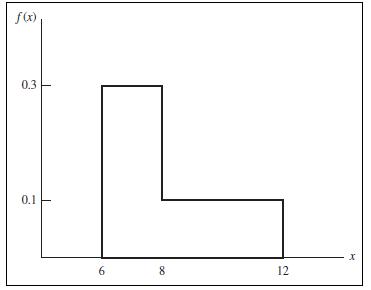
23. Verify that the function corresponding to the figure below is a valid probability density function. Then find the following probabilities:a. P(x 6 8)b. P(x 7 7)c. P(6 6 x 6 10)d. P(8 6 x 6 11) O 0.1 f(x) 0.3 6 8 12 X
22. The following table provides the frequencies of the number of alpha particles emitted by a certain radioactive system in 100 intervals of length 1/100 seconds.Number Frequency 0 0 1 1 2 4 3 13 4 19 5 16 6 15 7 9 8 12 9 8 10 3 Total 100a. Find the probability of emission of 0 to 10 alpha
21. A barber must serve 8 customers everyday to cover the infrastructural costs. His number of customers per day has a mean of 10. What is the probability that he will serve less than 8 customers a day?
20. In a shooting competition, a participant hits the target at any shot with a probability of 0.5. What is the minimum number of shots needed to make the probability of at least 8 hits equal to or greater than 0.9?
19. A popular resort hotel has 300 rooms and is usually fully booked. About 4% of the time a reservation is cancelled before the 6:00 p.m. deadline with no penalty.What is the probability that at least 280 rooms will be occupied? Use the binomial distribution to find the exact value and the normal
18. Pairs of chips, one each from brands A and B, are tested for their longevity. In 100 such experiments, brand A came out on top 65 times. What is the probability that this performance or better can happen just by chance?
17. A multiple choice test has 30 problems, and 4 choices for each problem. A student taking the test does not know the correct answer for any of the problems and guesses the answer for each. What is the probability that the student will answer at least 10 questions correctly?
16. What type of distribution models the random variable Prior Call Center Experience in the file Call Center Data? Define the parameter(s) for this distribution based on the data.
15. A major application of data mining in marketing is determining the attrition of customers. Suppose that the probability of a long‐distance carrier’s customer leaving for another carrier from one month to the next is 0.15. What distribution models the retention of an individual customer?
14. A bakery has the following probability distribution for the daily demand for its cakes:Demand, x(in hundreds) Probability, f(x)0 0.04 1 0.16 2 0.18 3 0.28 4 0.34 5 or more 0.00 Find the expectation, variance and the standard deviation of the daily demand for cakes.
13. Using the data in the Excel file Room Inspection, construct the probability mass function and the cumulative distribution function (both tabular and as charts) for the random variable Number of Nonconforming Rooms.What is the probability that the number of nonconforming rooms is greater than
12. Based on the data in the Excel file Facebook Survey, develop a probability mass function and cumulative distribution function (both tabular and as charts) for the random variable Hours Online/Week. What is the probability that an individual in this survey is online on Facebook for two hours per
11. Construct the probability distribution for the value of a 2‐card hand dealt from a standard deck of 52 cards (all face cards have a value of 10 and an ace has a value of 11).a. What is the probability of being dealt 21?b. What is the probability of being dealt 16?c. Construct a chart for the
10. A survey based on the general adult population of an American city shows that among the surveyed individuals, 60% are cigarette smokers and 3% of the smokers have lung cancer. On the other hand, only 1% of the non-smokers have lung cancer. Construct the joint probability distribution table of
9. A research laboratory proposes a medical test for a certain disease. It is known that 5% of the individuals of the population have this disease. Suppose the probability that the test indicates that an individual is healthy when he/she actually has the disease is 0.1, while the probability that
8. Use the Civilian Labor Force data in the Excel file Census Education Data to find the following:a. P (Unemployed and Advanced Degree)b. P (Unemployed | Advanced Degree)c. P (Not a High School Grad | Unemployed)d. Are the events “Unemployed” and “at least a High School Graduate”
7. Row 27 of the Excel file Census Education Data gives the number of unemployed persons having a specific educational level.a. Find the probability that an employed person has attained each of the educational levels listed in the data.b. Suppose that A is the event “has at least an Associate’s
6. A survey of 150 residents of a certain city found that 120 residents subscribed to the morning newspaper, 75 subscribed to the evening newspaper, and 50 subscribed to both. A resident is chosen at random from the group of these 150 residents.a. What is the probability that the selected resident
5. A regular six faced die is rolled 100 times, leading to the following frequencies.Number Frequency 1 20 2 16 3 18 4 10 5 14 6 22a. What is the probability of getting the number 2?b. What is the probability of getting a number greater than 4?
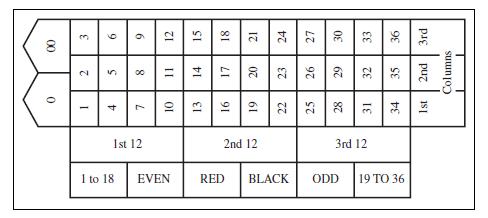
4. Roulette is played at a table similar to the one in Figure 3.22 . A wheel with the numbers 1 through 36(evenly distributed with the colors red and black) and two green numbers 0 and 00 rotates in a shallow bowl with a curved wall. A small ball is spun on the inside of the wall and drops into a
3. A company places 3 digit serial numbers on each part that is made. Any number between 0 and 9 may be used in the digits. How many different serial numbers are possible ifa. Digits can be repeated?b. Digits cannot be repeated?
2. A fair coin is tossed three times.a. List all possible outcomes in the sample space. Find the probability associated with each outcome.b. Let A be the event “exactly 3 heads.” Find P ( A ).c. Let B be the event “at most 2 heads.” Find P ( B ).d. Let C be the event “at least 2 heads.”
1. Consider a regular deck of cards where the cards ace, jack, queen, and king are numbered 1, 11, 12, and 13 respectively. Consider the experiment of drawing two cards randomly from this deck without replacement.a. Describe the outcomes of this experiment. List the elements of the sample space.b.
16. Describe the joint probability distribution of two random variables. How are marginal probabilities calculated?When are the random variables independent?
15. What is the standard normal distribution? How and under what conditions can the normal distribution be used to find binomial probabilities?
14. Explain practical situations in which the uniform, normal, triangular, and exponential distributions might be used.
13. Explain the role of shape, scale, and location parameters in continuous probability distributions.
12. What properties must a continuous probability distribution have? How are probabilities defined for continuous distributions?
11. Briefly summarize the important characteristics and appli cations of the Bernoulli, binomial, and Poisson distributions.
10. What are the basic rules of probability?
9. Why can we not define probability for a point?
8. What is the multiplicative rule of probability?
7. What is a random variable? Explain the difference between discrete and continuous random variables.
6. What is meant by the independence of two events, A and B ? If A and B are mutually exclusive, can they be independent?
5. Explain the notion of conditional probability and how it is computed.
4. Explain the concept of mutually exclusive events. How do you compute the probability P ( A or B ) when A and B are, and are not, mutually exclusive?
3. What is the complement of an event and how do you find its probability?
2. Define probability and explain its three perspectives.Provide an example of each.
1. Explain the concepts of an experiment, outcome, sample space, and event. Provide some examples different from those in the chapter.
36. The Excel file Freshman College Data shows data for four years at a large urban university. Use PivotTables to examine differences in student high school performance and first‐year retention among different colleges at this university. What conclusions do you reach?
35. The Excel file Cell Phone Survey reports opinions of a sample of consumers regarding the signal strength, value for the dollar, and customer service for their cell phone carriers. Use PivotTables to find the following:a. The average signal strength by type of carrier.b. Average value for the
34. A mental health agency measured the self‐esteem score for randomly selected individuals with disabilities who were involved in some work activity within the past year. The Excel file Self‐Esteem provides the data including the individuals’ marital status, length of work, type of support
33. The Excel file MBA Student Survey provides data on a sample of students’ social and study habits. Use PivotTables to find the average age, number of nights out per week, and study hours per week by gender, whether the student is international or not, and undergraduate concentration.
32. A national homebuilder builds single‐family homes and condominium‐style townhouses. The Excel file House Sales provides information on the selling price, lot cost, type of home, and region of the country (M =Midwest, S = South) for closings during one month. Use PivotTables to find the
31. The Excel file University Grant Proposals provides data on the dollar amount of proposals, gender of the researcher, and whether the proposal was funded or not. Construct a PivotTable to find the average amount of proposals by gender and outcome.
30. Call centers have high turnover rates because of the stressful environment. The national average is approximately 50%. The director of human resources for a large bank has compiled data from about 70 former employees at one of the bank’s call centers (see the Excel file Call Center Data ).
29. A producer of computer‐aided design software for the aerospace industry receives numerous calls for technical support. Tracking software is used to monitor response and resolution times. In addition, the company surveys customers who request support using the following scale:0—Did not
28. Construct box plots and dot‐scale diagrams for each of the variables in the data set Ohio Education Performance.What conclusions can you draw from them? Are any possible outliers evident?
27. The Excel file Unions and Labor Law Data reports the percentage of public and private sector employees in unions in 1982 for each state, along with indicators of whether the states had a bargaining law that covered public employees or right‐to‐work laws.a. Compute the proportion of
26. Construct cross‐tabulations of Gender versus Carrier and Type versus Usage in the Excel file Cell Phone Survey .What might you conclude from this analysis?
25. A mental health agency measured the self‐esteem score for randomly selected individuals with disabilities who were involved in some work activity within the past year. The Excel file Self Esteem provides the data, including the individuals’ marital status, length of work, type of support
24. The Excel file EEO Employment Report shows the number of people employed in different professions for various racial and ethnic groups. Find the proportion of men and women in each ethnic group for the total employment and in each profession.
23. The worksheet Mower Test in the Excel file Quality Measurements shows the results of testing 30 samples of 100 lawn mowers prior to shipping. Find the proportion of units that failed the test for each sample. What proportion failed overall?
22. The Excel file Refrigerators provides data on various brands and models. Compute the correlation matrix for the variables. What conclusions can you draw?
21. The Excel file Infant Mortality provides data on infant mortality rate (deaths per 1,000 births), female literacy(percentage who read), and population density (people per square kilometer) for 85 countries. Compute the correlation matrix for these three variables. What conclusions can you draw?
20. A national homebuilder builds single‐family homes and condominium‐style townhouses. The Excel file House Sales provides information on the selling price, lot cost, type of home, and region of the country (M =Midwest, S = South) for closings during one month.a. Construct a scatter diagram
19. Call centers have high turnover rates because of the stressful environment. The national average is approximately 50%. The director of human resources for a large bank has compiled data from about 70 former employees at one of the bank’s call centers (see the Excel file Call Center Data ).
18. A deep‐foundation engineering contractor has bid on a foundation system for a new world headquarters building for a Fortune 500 company. A part of the project consists of installing 311 auger cast piles. The contractor was given bid information for cost‐estimating purposes, which consisted
17. Data from the 2000 U.S. Census in the Excel file California Census Data show the distribution of ages for residents of California. Estimate the mean age and standard deviation of age for California residents using formulas (2A.9)and (2A.11), assuming these data represent a sample of current
16. In a chess tournament involving 64 players, the ages of the contestants were summarized in a frequency table which gave the following information:• Ages between 15 and 24: 6 contestants• Ages between 25 and 34: 25 contestants• Ages between 35 and 44: 18 contestants• Ages between 45 and
15. The data in the Excel file University Grant Proposals presents the amount of funding requested by each grant proposal.Using formulas (2.A8) and (2.A10), estimate the mean and standard deviation of the requested funding in the grant proposals, assuming these data represent the entire population
14. Compute descriptive statistics for all colleges and branch campuses for each year in the Excel file Freshman College Data . Are any differences apparent from year to year?
13. Compute descriptive statistics for liberal arts colleges and research universities in the Excel file Colleges and Universities . Compare the two types of colleges. What can you conclude?
12. For the Excel file University Grant Proposals, compute descriptive statistics for all proposals and also for the proposals that were funded and those that were rejected. Are any differences apparent?
11. The Excel file Baseball Attendance shows the attendance in thousands at San Francisco Giants baseball games for the 10 years before the Oakland A’s moved to the Bay Area in 1968, as well as the combined attendance for both teams for the next 11 years. What is the mean and standard deviation
10. The Excel file Burglaries contains data on the number of burglaries before and after a Citizen Police program.Apply the Descriptive Statistics tool to these data. Does Chebyshev’s theorem hold for the number of monthly burglaries before and after the citizen-police program?
9. The Excel file Student Grades provides information about the performance of students in a midterm examination and in a final exam.a. Considering these data as a sample from the population of all students in this institution, compute the mean, variance, and standard deviation for each of these
8. Compute the mean, median, variance, and standard deviation using the appropriate Excel functions for all the variables in the Excel file National Football League.Note that the data represent a population. Apply the Descriptive Statistics tool to these data, what differences do you observe? Why
7. Find the 10th and 90th percentiles and the first and third quartiles for the taxi-in time in the Excel file Atlanta Airline Data .
6. Find the first, second, and third quartiles for the variables Current Salary and Education in the Excel file Salary Data. What is the interquartile range for each of these?
5. Find the 10th and 90th percentiles of the number of hits by the different teams in the Excel file Major League Baseball.
4. Construct frequency distributions and histograms using the Excel Histogram tool for the total nuclear power production for the US, Canada and France in the Excel file Nuclear Power . Define appropriate bin ranges for each variable.
3. Construct a frequency distribution and histogram for driving accuracy (%) in the Excel file Golfing Statistics using the Excel Histogram tool and appropriate bin ranges. Find the relative frequencies and cumulative relative frequencies for each bin, and estimate the average accuracy using the
2. The Excel file MBA Student Survey provides demographic data and responses to questions on the number of nights out per week and study hours per week for a group of MBA students. Construct frequency distributions and compute the relative frequencies for the categorical variables of gender,
1. A community health status survey obtained the following demographic information from the respondents:Age Frequency 18–29 297 30–45 661 46–64 634 65+ 369 Compute the relative frequency and cumulative relative frequency of the age groups. Also, estimate the average age of the sample of
18. Explain why the sign of the covariance measure indicates the direction of the relationship between the variables of interest.
17. How can one estimate the mean and variance of data that are summarized in a grouped frequency distribution?Why are these only estimates?
16. Explain how to compute the mean and variance of a sample and a population. How would you explain the formulas in simple English?
15. What is a PivotTable? Describe some of the key features that PivotTables have.
14. Explain the information contained in box plots and dotscale diagrams.
13. What is an outlier? How can one be identified?
12. What is a proportion? Provide some practical examples where proportions are used in business.
11. What does the correlation coefficient measure? How do you interpret a correlation coefficient of zero?
10. What does kurtosis measure? Interpret the value of the coefficient of kurtosis as obtained in Excel.
9. Explain the coefficient of variation and how it can be used.
8. What does Chebyshev’s theorem state and how can it be used in practice?
7. Explain the importance of the standard deviation in interpreting and drawing conclusions about risk.
6. What does skewness measure? Interpret the value of the coefficient of skewness as obtained in Excel.
Showing 1400 - 1500
of 2398
First
8
9
10
11
12
13
14
15
16
17
18
19
20
21
22
Last
Step by Step Answers