New Semester
Started
Get
50% OFF
Study Help!
--h --m --s
Claim Now
Question Answers
Textbooks
Find textbooks, questions and answers
Oops, something went wrong!
Change your search query and then try again
S
Books
FREE
Study Help
Expert Questions
Accounting
General Management
Mathematics
Finance
Organizational Behaviour
Law
Physics
Operating System
Management Leadership
Sociology
Programming
Marketing
Database
Computer Network
Economics
Textbooks Solutions
Accounting
Managerial Accounting
Management Leadership
Cost Accounting
Statistics
Business Law
Corporate Finance
Finance
Economics
Auditing
Tutors
Online Tutors
Find a Tutor
Hire a Tutor
Become a Tutor
AI Tutor
AI Study Planner
NEW
Sell Books
Search
Search
Sign In
Register
study help
business
essential statistics
Elementary Statistics 3rd International Edition William Navidi, Barry Monk - Solutions
Explain why extrapolation may lead to unreliable results.
Describe circumstances under which the sum of the squared residuals will equal zero. What conclusions can be drawn about the least-squares regression line in this case?
Describe conditions under which the slope of the least-squares line will be equal to the correlation coefficient.
If the slope of the least-squares regression line is negative, can the correlation coefficient be positive? Explain why or why not.
Explain why the predicted value ̂y is always equal to ̄y when r = 0.
Two variables x and y have a positive association if large values of x are associated with large values of y. Write an equivalent definition that describes what small values of x are associated with. Then write a definition for negatively associated random variables that describes what small values
Describe an example in which two variables are strongly correlated, but changes in one do not cause changes in the other.
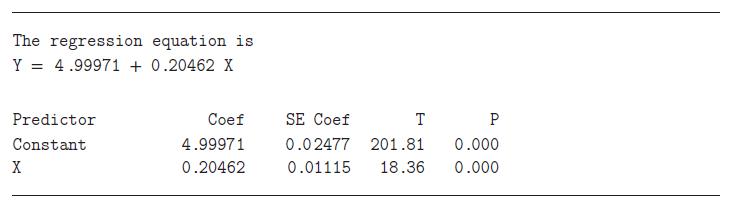
Interpret technology: The following output from MINITAB presents the results from computing a least-squares regression line.a. Write the equation of the least-squares regression line.b. Predict the value of y when the x-value is 25. The regression equation is Y = 4.99971 + 0.20462 X Predictor
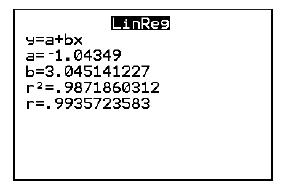
Interpret technology: The following display from the TI-84 Plus calculator presents the results from computing a least-squares regression line.a. Write the equation of the least-squares regression line.b. Predict the value of y when the x-value is 50.c. What is the correlation between x and y?d. Is
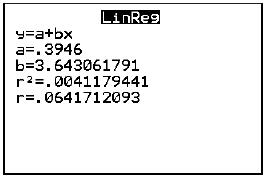
Interpret technology: The following display from the TI-84 Plus calculator presents the results from computing a least-squares regression line.a. Write the equation of the least-squares regression line.b. Predict the value of y when the x-value is 10.c. What is the correlation between x and y?d. Is
Commute times: Every morning, Tania leaves for work a few minutes after 7:00 A.M. For eight days, she keeps track of the time she leaves (the number of minutes after 7:00) and the number of minutes it takes her to get to work. Following are the results.a. Construct a scatterplot of the length of
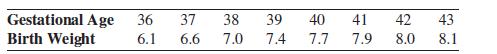
Baby weights: The average gestational age (time from conception to birth) of a newborn infant is about 40 weeks. The following table presents the gestational age (in weeks) and corresponding mean birth weight (in pounds) for female infants born in Canada.a. Compute the least-squares regression line
SAT scores: Using the data in Exercise 9:a. Compute the correlation coefficient between years of study and SAT score.b. Compute the coefficient of determination.c. How much of the variation in SAT score is explained by the least-squares regression line?
SAT scores: The following table presents the number of years of study in English and language arts and the average SAT writing score for students who took the SAT exam.a. Compute the least-squares regression line for predicting mean SAT score from years of study.b. Construct a residual plot. Verify
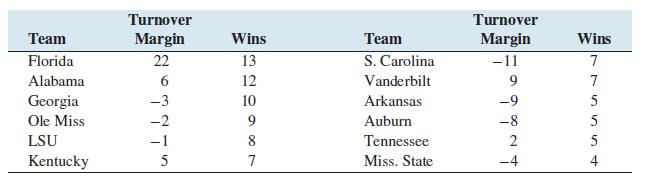
Pigskin: Using the data in Exercise 7:a. Compute the correlation coefficient between turnover margin and wins.b. Compute the coefficient of determination.c. How much of the variation in wins for this SEC college football season is explained by the least-squares regression line?
Pigskin: In football, a turnover occurs when a team loses possession of the ball due to a fumble or an interception.Turnovers are bad when they happen to your team, but good when they happen to your opponent. The turnover margin for a team is the difference (Turnovers by opponent − Turnovers by
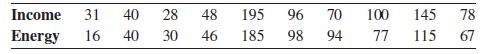
Energy efficiency: Using the data in Exercise 5:a. Compute the correlation coefficient between income and energy consumption.b. Compute the coefficient of determination.c. How much of the variation in energy consumption is explained by the least-squares regression line?
Energy efficiency: A sample of 10 households was monitored for one year. The household income (in $1000s) and the amount of energy consumed (in 1010 joules) were determined. The results follow.a. Compute the least-squares regression line for predicting energy consumption from income.b. Construct a
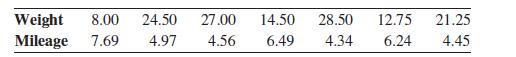
How’s your mileage? Using the data in Exercise 3:a. Compute the correlation coefficient between weight and mileage.b. Compute the coefficient of determination.c. How much of the variation in mileage is explained by the least-squares regression line?
How’s your mileage? Weight (in tons) and fuel economy (in mpg) were measured for a sample of seven diesel trucks.The results are presented in the following table.a. Compute the least-squares regression line for predicting mileage from weight.b. Construct a residual plot. Verify that a linear
How much wood is in that tree? For a sample of 12 trees, the volume of lumber (y) (in cubic meters) and the diameter(x) (in centimeters) at a fixed height above ground level was measured. The following summary statistics were obtained:̄x = 36.1 sx = 8.8 ̄y = 0.86 sy = 0.49 r = 0.94a. Compute the
Predicting height: The heights (y) and lengths of forearms (x) were measured in inches for a sample of men. The following summary statistics were obtained:̄x = 10.1 sx = 0.8 ̄y = 70.1 sy = 2.5 r = 0.81a. Compute the least-squares regression line for predicting height from forearm length.b.
The correlation coefficient for a data set is r = −0.6. How much of the variation in the outcome variable is explained by the least-squares regression line?
In a scatterplot, the point (−2, 7) is influential. If this point is removed from the scatterplot, which of the following describes the effect on the least-squares regression line?i. It will shift its position by a substantial amount.ii. It will shift its position slightly.iii. It will not shift
Should a prediction for the exam score be made for a student who slept for 10 hours? Why or why not?
A sample of students was studied to determine the relationship between sleeping habits and classroom performance. The least-squares regression line for predicting the score on a standardized exam from hours of sleep was computed to bêy = 35.6 + 6.8x, where x is the number of hours of sleep and
Two lines are drawn on a scatterplot. The sum of squared residuals for line A is 558.2, and the sum of squared residuals for line B is 723.1. Which of the following is true about the sum of squared residuals for the least-squares regression line?i. It will be greater than 723.1.ii. It will be
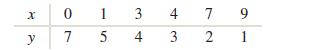
Compute the least-squares regression line for the following data set. x y 7 17 0 1 3 479 5 4 3 2 -
What is the correlation coefficient?
A scatterplot has a least-squares regression line with a slope of
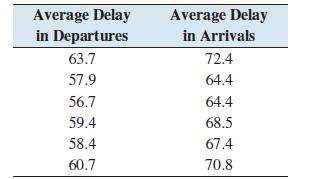
If the average delay in departure times differs by 2 minutes from one year to the next, by how much would you predict the average delay in arrival times to change?
Refer to Exercise
Use the least-squares regression line computed in Exercise 6 to compute the residual for the year when the average delay in departure time was 58.4 minutes and the average delay in arrival time was 67.4 minutes.
Use the least-squares regression line computed in Exercise 6 to predict the average delay in arrival time in a year when the average delay in departure time is 58.5 minutes.
The following table presents the average delay in minutes for departures and arrivals of domestic flights at O’Hare Airport in Chicago for selected years.Compute the least-squares regression line for predicting the delay in arrival time from the delay in departure time. Average Delay in
In a survey of U.S. cities, it is discovered that there is a positive correlation between the number of paved streets in the city and the number of registered cars. Does this mean that paving more streets in the city will result in an increase in the number of registered cars? Explain.
A scatterplot has a correlation of r = −1. Describe the pattern of the points.
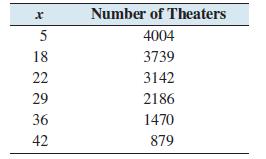
Use the data in Exercise 2 to compute the correlation between the number of days after the opening of the movie and the number of theaters showing the movie. Is the association positive or negative? Weak or strong?
The number of theaters showing the movie Monsters University x days after opening are presented in the following table.Construct a scatterplot with number of days on the horizontal axis and number of theaters on the vertical axis. S 18 5622 x Number of Theaters 4004 3739 22 3142 29 2186 36 1470 42
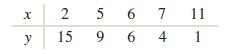
Compute the correlation coefficient for the following data set. x y 256 6 7 11 15 9 6 4 1
Percentiles are values that divide a data set into hundredths. The values that divide a data set into tenths are called deciles, denoted D1,D2, ...,D9. Describe the relationship between percentiles and deciles.
Is Chebyshev’s Inequality true when K < 1? Is it useful? Explain why or why not.
Does Chebyshev’s Inequality provide useful information when K = 1? Explain why or why not.
Explain why the Empirical Rule is more useful than Chebyshev’s Inequality for bell-shaped distributions. Explain why Chebyshev’s Inequality is more useful for distributions that are not bell-shaped.
The U.S. Department of Labor annually publishes an Occupational Outlook Handbook, which reports the job outlook, working conditions, and earnings for thousands of different occupations. The handbook reports both the mean and median annual earnings. For most occupations, which is larger, the mean or
More corporate profits: Using the data in Exercise 2:a. Find the first and third quartiles of the profit.b. Find the median profit.c. Find the upper and lower outlier boundaries.d. Are there any outliers? If so, list them.e. Construct a boxplot for these data.
Weights of soap: As part of a quality control study aimed at improving a production line, the weights (in ounces) of 50 bars of soap are measured. The results are shown below, sorted from smallest to largest.a. Find the first and third quartiles of these data.b. Find the median of these data.c.
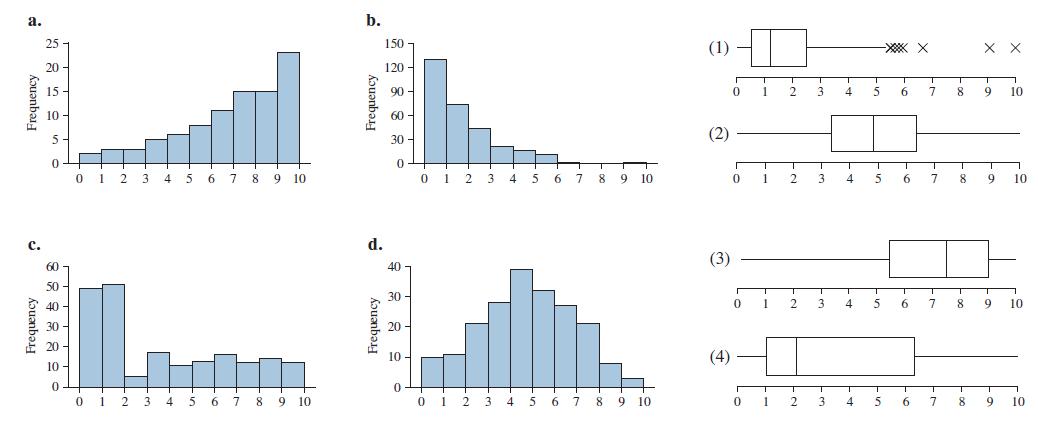
Matching: Match each histogram to the boxplot that represents the same data set. Frequency 60 50 40 30 a. 25 20 Frequency b. 150 120 (1) 15- 10- Frequency 90 T T T T T 0 1 2 3 4 5 6 7 8 9 10 60 5. 30 0 0 T T I I I 0 1 2 3 4 5 6 7 8 9 10 0 1 2 3 4 5 6 7 8 9 10 0 1 2 3 4 5 6 7 8 9 10 Frequency d. 40
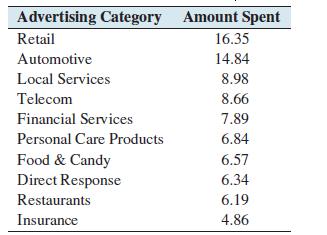
Advertising costs: The amounts spent (in billions) on media advertising in the United States for a sample of categories are presented in the following table.a. Find the mean amount spent on advertising.b. Find the median amount spent on advertising.c. Find the sample variance of the advertising
Paying rent: The monthly rents for apartments in a certain town have a mean of $800 with a standard deviation of $150.What can you determine about these data by using Chebyshev’s Inequality with K = 3?
How long can you talk? A manufacturer of cell phone batteries determines that the average length of talk time for one of its batteries is 470 minutes. Suppose that the standard deviation is known to be 32 minutes and that the data are approximately bell-shaped. Estimate the percentage of batteries
Rivets: A machine makes rivets that are used in the manufacture of airplanes. To be acceptable, the length of a rivet must be between 0.9 centimeter and 1.1 centimeters. The mean length of a rivet is 1.0 centimeter, with a standard deviation of 0.05 centimeter. What is the maximum possible
Time in surgery: Records at a hospital show that a certain surgical procedure takes an average of 162.8 minutes with a standard deviation of 4.9 minutes. If the data are approximately bell-shaped, between what two values will about 95% of the data fall?
Measure that ball: Each of 16 students measured the circumference of a tennis ball by two different methods:A: Estimate the circumference by eye.B: Measure the circumference by rolling the ball along a ruler.The results (in centimeters) are given below, in increasing order for each method:a.
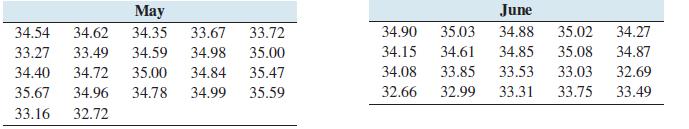
More stock prices: Using the data in Exercise 5:a. Find the population standard deviation of the prices in May.b. Find the population standard deviation of the prices in June.c. Financial analysts use the word volatility to refer to the variation in stock prices. Was the volatility for the price of
Stock prices: Following are the closing prices of Microsoft stock for each trading day in May and June of a recent year.a. Find the mean and median price in May.b. Find the mean and median price in June.c. Does there appear to be a substantial difference in price between May and June? Or are the
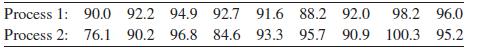
More computer chips: Using the data in Exercise 3:a. Find the sample variance of the thicknesses for each process.b. Find the sample standard deviation of the thicknesses for each process.c. Which process appears to be better in producing a uniform thickness? Explain.
Computer chips: A computer chip is a wafer made of silicon that contains complex electronic circuitry made up of microscopic components. The wafers are coated with a very thin coating of silicon dioxide. It is important that the coating be of uniform thickness over the wafer. To check this,
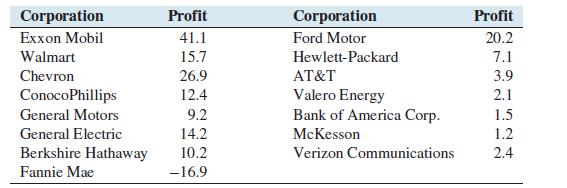
Corporate profits: The following table presents the profit, in a recent year, in billions of dollars, for each of the 15 largest U.S. corporations in terms of revenue.a. Find the mean profit.b. Find the median profit.c. Are these data skewed to the right, skewed to the left, or approximately
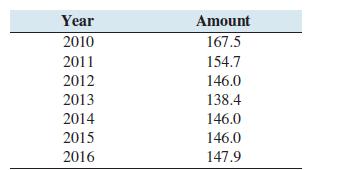
Support your local artist: Following are the annual amounts of federal support (in millions of dollars) for National Endowment for the Arts programs for the years 2010 through 2016.a. Find the mean annual amount of federal aid from 2010 through 2016.b. Find the median annual amount of federal aid
Construct a boxplot for the data in Exercise 14.
The prices (in dollars) for a sample of coffee makers are:19 22 29 68 35 37 28 22 41 39 28a. Find the first and third quartiles.b. Find the upper and lower outlier boundaries.c. Are there any outliers? If so, list them.
What is the IQR?
The five-number summary for a sample is 7, 18, 35, 62,
True or false: If a student’s exam grade is on the 55th percentile, then approximately 45% of the scores are below his or her grade.
Find the coefficient of variation of the salaries.
John’s starting salary is $38,180. What is the z-score of his salary?
Assume it is not known whether the histogram of starting salaries is bell-shaped. Fill in the blank: At least percent of the salaries will be between $34,680 and $40,280.
Assume that the histogram of starting salaries is approximately bell-shaped. Approximately what percentage of the salaries will be between $34,680 and $40,280?
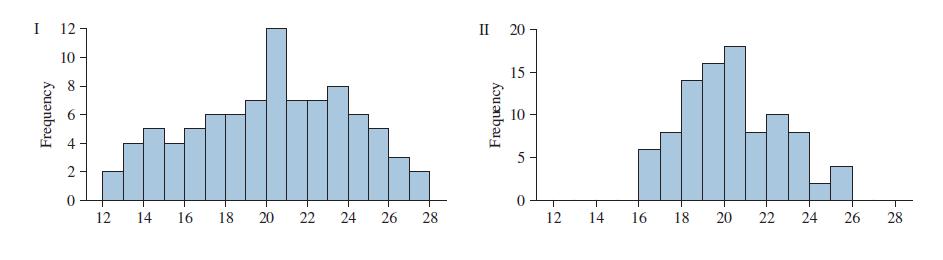
One has a standard deviation of 3.96 and the other has a standard deviation of 2.28. Which is which? Fill in the blanks: Histogram I has a standard deviation of and histogram II has a standard deviation of . I 12 10 8. Frequency 9 6. 12 14 16 18 20 22 22 24 II 20 20 Frequency 15 110 5 T 96 26 28 12
Each of the following histograms represents a data set with mean
What is the standard deviation?
A sample has a variance of
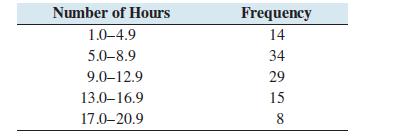
A sample of 100 students was asked how many hours per week they spent studying. The following frequency table shows the results:a. Approximate the mean time this sample of students spent studying.b. Approximate the standard deviation of the time this sample of students spent studying. Number of
In general, a histogram is skewed to the left if the is noticeably less than the .
Calculate the mean, median, and mode for this sample.
The prices (in dollars) for a sample of personal computers are: 550, 700, 420, 580, 550, 450, 690, 390,
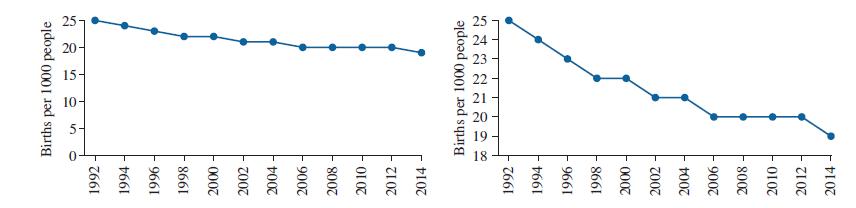
Falling birth rate: The following time-series plots both present estimates for the number of births per 1000 people worldwide for the years 1992–2014.Which of the following statements is more accurate? Explain your reasoning.(i) The birth rate decreased somewhat between 1992–2014.(ii) The birth
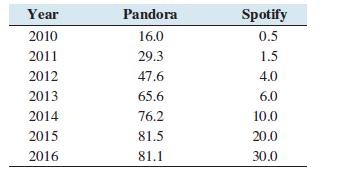
Pandora vs. Spotify: Following are the numbers of subscribers (in millions) to the music streaming services Pandora and Spotify for the years 2010 through 2016:a. Construct a time-series plot for the number of Pandora subscribers.b. Construct a time-series plot for the number of Spotify
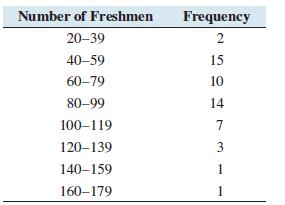
House freshmen: Newly elected members of the U.S. House of Representatives are referred to as ‘‘freshmen.’’ The following frequency distribution presents the number of freshmen elected in each of the past 53 elections, from 1912 to 2016.a. How many classes are there?b. What is the class
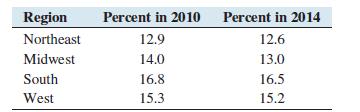
Poverty rates: The following table presents the percentage of people who lived in poverty in the various regions of the United States in the years 2010 and 2014.a. Construct a side-by-side bar graph for these data.b. True or false: The poverty rate was lower in 2014 than in 2010 in each region.c.
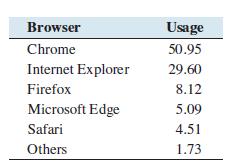
Internet browsers: The following relative frequency distribution presents the usage in percent of various Internet browsers worldwide in 2016.a. Construct a relative frequency bar graph.b. Construct a pie chart.c. True or false: There are more than twice as many Chrome users than Internet Explorer
Following are the prices (in dollars) for a sample of espresso makers.99 50 31 65 50 99 70 40 25 56 30 77 Construct a back-to-back stem-and-leaf plot for these data and the data in Exercise 11.
Following are the prices (in dollars) for a sample of coffee makers.19 22 29 68 35 37 28 22 41 39 28 Construct a stem-and-leaf plot for these data.
Rather than send out questionnaires, the investigators could have telephoned a random sample of people over a period of days. Explain how this might have reduced the confounding.
It is generally the case in epidemiologic studies that people who have symptoms are often eager to participate, while those who are unaffected are less interested. Explain how this may cause the mode of response (school or mail) to be related to the outcome.
As the weather gets warmer, PM goes down because wood stoves are used less. Explain how this causes the mode of response (school or mail) to be related to PM.
Explain why the percentage of high-exposure people with wheeze symptoms is the same as the percentage of school-return people with wheeze symptoms.
Is there a large difference between the percentage of high-exposure people with wheeze symptoms and the percentage of low-exposure people with wheeze symptoms?
What percentage of the low-exposure people had wheeze symptoms?
How many of the low-exposure people had wheeze symptoms?
How many people had low exposure to PM?
What percentage of the high-exposure people had wheeze symptoms?
How many of the high-exposure people had wheeze symptoms?
How many people had high exposure to PM?
Cell phones and driving: To determine whether using a cell phone while driving increases the risk of an accident, a researcher examines accident reports to obtain data about the number of accidents in which a driver was talking on a cell phone.a. Is this a randomized experiment or an observational
Better gas mileage: A taxi company in a large city put a new type of tire with a special tread on a random sample of 50 cars, and the regular type of tire on another random sample of 50 cars. After a month, the gas mileage of each car was measured.a. Is this a randomized experiment or an
Nominal or ordinal? Is the color of a smartphone nominal or ordinal?
Showing 2300 - 2400
of 2398
First
10
11
12
13
14
15
16
17
18
19
20
21
22
23
24
Step by Step Answers