New Semester
Started
Get
50% OFF
Study Help!
--h --m --s
Claim Now
Question Answers
Textbooks
Find textbooks, questions and answers
Oops, something went wrong!
Change your search query and then try again
S
Books
FREE
Study Help
Expert Questions
Accounting
General Management
Mathematics
Finance
Organizational Behaviour
Law
Physics
Operating System
Management Leadership
Sociology
Programming
Marketing
Database
Computer Network
Economics
Textbooks Solutions
Accounting
Managerial Accounting
Management Leadership
Cost Accounting
Statistics
Business Law
Corporate Finance
Finance
Economics
Auditing
Tutors
Online Tutors
Find a Tutor
Hire a Tutor
Become a Tutor
AI Tutor
AI Study Planner
NEW
Sell Books
Search
Search
Sign In
Register
study help
business
essential statistics
Statistics Data Analysis And Decision Modeling 5th International Edition James R. Evans - Solutions
29. For the data in the file Accounting Professionals , perform a chi-square test to determine whether gender and CPA status are independent.
28. A mental health agency measured the self‐esteem score for randomly selected individuals with disabilities who were involved in some work activity within the past year. The Excel file Self Esteem provides the data, including the individuals’ marital status, length of work, type of support
27. Using the data in the Excel file Freshman College Data, use ANOVA to determine whether the mean retention rate is the same for all colleges over the 4‐year period.Second, use ANOVA to determine if the mean ACT and SAT scores are the same each year over all colleges. If the null hypothesis is
26. An engineer measured the surface finish of 35 parts produced on a lathe, noting the revolutions per minute of the spindle and the type of tool used (see the Excel file Surface Finish ). Use ANOVA to test the hypothesis that the mean surface finish is the same for each tool. If the null
25. For the data in the Excel file Cell Phone Survey , apply ANOVA to determine if the mean signal strengths are the same for the three different types of cell phones.
24. For the data in the Excel file Student Grades , perform an appropriate test to determine whether the average scores for the midterm and the final are the same.
23. Consider the data given in the Excel file Unions and Labor Laws . Perform a test of hypothesis for testing the equality of variances of the percentages of employees in unions in the public sector:a. for states having bargaining laws and states not having bargaining laws.b. for states having
22. For the data in the Excel file Golfing Statistics , test whether the variance of the driving distance of the group having driving accuracy less than 60% is the same as that of the group having accuracy greater than 60%.
21. The Excel file Unions and Labor Law Data reports the percentage of public‐ and private‐sector employees in unions in 1982 for each state, along with indicators whether the states had a bargaining law that covered public employees or right‐to‐work laws.a. Test the hypothesis that the
20. Some analysts feel that the Ohio Education Program is doing well in reading and writing, but not so in science and math. Perform a paired sample test to determine whether the mean math score is significantly smaller than the mean writing score.
19. Jim Aspenwall, a NASCAR enthusiast, has compiled some key statistics for NASCAR Winston Cup racing tracks across the United States. These tracks range in shape, length, and amount of banking on the turns and straightaways (see the Excel file NASCAR Track Data ).Test the hypothesis that there is
18. A producer of computer‐aided design software for the aerospace industry receives numerous calls for technical support. Tracking software is used to monitor response and resolution times. In addition, the company surveys customers who request support using the following scale: 0—Did not
17. The director of human resources for a large bank has compiled data on about 70 former employees at one of the bank’s call centers (see the Excel file Call Center Data ). For each of the following, assume equal variances of the two populations.a. Test the null hypothesis that the average
16. A study of nonfatal occupational injuries in the United States found that about 31% of all injuries in the service sector involved the back. The National Institute for Occupational Safety and Health (NIOSH) recommended conducting a comprehensive ergonomics assessment of jobs and workstations.
15. For the data in the Excel file Graduate School Survey, perform a test for proportions at level 10% to determine whether the proportion of individuals who plan to attend graduate school is the same for married and unmarried groups.
14. In the Excel file Cell Phone Survey, test the hypothesis that the mean responses for Value for the Dollar and Customer Service do not differ by gender.
13. The Excel file Accounting Professionals provides the results of a survey of 27 employees in a tax division of a Fortune 100 company.a. Test the null hypothesis that the average number of years of service is the same for males and females.b. Test the null hypothesis that the average years of
12. Determine if there is evidence to conclude that the mean number of vacations taken by married individuals is less than the number taken by single/divorced individuals using the data in the Excel file Vacation Survey .
11. Do males and females have the same number of friends? Use the data in the Excel file Facebook Survey and perform an appropriate test to determine whether the mean number of friends for the two genders is the same.
10. An Internal Revenue Service auditor ran a test on a sample of income tax returns filed in two successive years to check whether the average refund for taxpayers is larger this year compared to the last. The mean and standard deviation for last year’s and this year’s samples are as given
9. Using the data in the Excel file Consumer Transportation Survey, test the following null hypotheses:a. Individuals spend at least 10 hours per week in their vehicles.b. Individuals drive an average of 450 miles per week.c. The average age of SUV drivers is no greater than 35.d. At least 75% of
8. In the Excel file Gasoline Prices, determine if there is evidence to conclude that the variance of weekly prices during 2009 is less than 10%.
7. In the Excel file New Account Processing, test the null hypothesis that the variance in the Close Ratio for the sample of employees is at most 1.5%.
6. It is claimed by some sources that, on the basis of the numbers presented in the Excel file Atlanta Airline Data , 65% or more of the total number of flights arrive early. Perform a test of hypothesis for this data to verify whether this claim can be supported.
5. The Excel file Call Center Data provides data on the background of call center employees. The company would like at least 40% of its employees to have a college degree. Perform a test with this data to determine whether there is evidence to claim that the company’s requirements are not met.
4. The Excel file Sales Data provides data on a sample of customers. The company believes that its average profit is no less than $5000. However, some analysts feel that its average profit may actually be lower. Test a hypothesis to verify this. If, for the same sample and the same value of the
3. Formulate and test a hypothesis to determine if statistical evidence suggests that the graduation rate for either top liberal arts colleges or research universities in the sample Colleges and Universities exceeds 90%. Do the data support a conclusion that the graduation rate exceeds 85%? Would
2. The state of Ohio Department of Education has a mandated ninth‐grade proficiency test that covers writing, reading, mathematics, citizenship (social studies), and science. The Excel file Ohio Education Performance provides data on success rates (defined as the percentage of students passing)
1. A company claims that the average nicotine content of its cigarettes is no more than 13 milligrams. An experimenter has selected a sample of 100 cigarettes from this company. Set up an appropriate hypothesis test to verify the company’s claim.
16. Explain the purpose of the chi‐square test for independence.Provide some practical examples where this test might be used in business.
15. What are the key assumptions of ANOVA? What should be done if these are seriously violated?
14. What is analysis of variance? What hypothesis does it test? Provide some practical examples.
13. Explain how to interpret the Excel results for a hypothesis test for equality of variances.
12. In many statistical applications, we may be interested in finding confidence intervals for, or testing hypotheses about, the same set of parameters. Explain the link between the confidence level and the significance level in these cases.
11. What is the difference between paired and independent samples?
10. Explain the peculiar nuances associated with the Excel tools for two‐sample t ‐tests. What issues must you consider to use the tests and interpret the results properly?
9. How are Type II errors influenced by the true (unknown)population mean and sample size used in a hypothesis test?
8. Explain the difference between the rejection region and p -value approaches for reaching a decision in a hypothesis test.
7. What is the difference between the significance level and the observed significance level?
6. How can you determine when to use a lower one‐tailed test of hypothesis versus an upper one‐tailed test?
5. Explain how the rejection region is determined for a hypothesis test. How does it differ between one‐ and two‐tailed tests?
4. Define the significance level of a hypothesis test, and the two kinds of errors associated with testing.
3. Explain why it is always necessary to specify a fixed null value in the one-sample hypothesis test, while such specifications are generally not necessary for the two-sample hypothesis test.
2. Explain the difference between the null and alterna tive hypothesis. Which one can be proven in a statistical sense?
1. How is the hypothesis testing problem different from that of estimation? Explain the general construction and steps in a hypothesis test.
30. The Excel file Student Grades contains data on midterm and final exam grades in one section of a large statistics course.Construct a 95% confidence interval for the mean difference in grades between the midterm and final exams.
29. The Excel file Mortgage Rates contains time‐series data on rates of three different mortgage instruments. Assuming that the data are stationary, construct a 95% confidence interval for the mean difference between the 30‐year and 15‐year fixed rate mortgage rates. Based on this confidence
28. Suppose that scores on a standardized test in mathematics taken by students from large and small high schools are N(mX, s2) and N(mY, s2) respectively, where s2 is unknown. A random sample of n = 16 students from large high schools yielded an average and standard deviation of 81.31 and 7.8
27. An experiment was conducted to compare people’s reaction times to a red light versus a green light. When signaled with either the red or the green light, the subject was asked to hit a switch to turn off the light. When the switch was hit, a clock was turned off and the reaction time in
26. For the Excel file Burglaries , find 95% confidence and prediction intervals for the number of burglaries before and after the Citizen Police meetings. How do they compare?
25. The Excel file Restaurant Sales provides sample information on lunch, dinner, and delivery sales for a local Italian restaurant. Develop 95% prediction intervals for the dollar sales of each of these variables for next Saturday.
24. Using the data in the worksheet Consumer Transportation Survey, develop 95% and 99% prediction intervals for the following:a. the hours per week that an individual will spend in his or her vehicleb. the number of miles driven per week Compare these to the confidence intervals developed in
23. The state of Ohio Department of Education has a mandated ninth‐grade proficiency test that covers writing, reading, mathematics, citizenship (social studies), and science. The Excel file Ohio Education Performance provides data on success rates (defined as the percentage of students passing)
22. The Excel file Baseball Attendance shows the attendance in thousands at San Francisco Giants’ baseball games for the 10 years before the Oakland A’s moved to the Bay Area in 1968, as well as the combined attendance for both teams for the next 11 years.a. Do the data appear to be
21. A researcher wants to estimate the proportion of secretaries of Fortune 500 companies who have personal computers at their workstations. How large should the sample be if the researcher is to be 95% confident that the difference between the sample estimate and the actual proportion is no more
20. It is known that the standard deviation of the lifetime of light bulbs manufactured by a company is 30 hours.How large should the sample size be so that we are 90%confident that the estimated mean lifetime of these light bulbs is no more than ± 3 hours away from the true lifetime?
19. The Excel file New Account Processing provides data for a sample of employees in a company. Assume that the company has 125 people in total assigned to new account processing. Find a 95% confidence interval for the total sales of the population of account representatives.
18. In a sample of 64 different restaurants belonging to a fast food chain, the average monthly electricity bill is$2000 with the standard deviation of $300. Find the 99% confidence interval for the mean electricity bill of the population of different restaurants of this fast food chain.
17. Using data in the Excel file Colleges and Universities, find 95% confidence intervals for the standard deviation of the median SAT for each of the two groups: liberal arts colleges and research universities. Based on these confidence intervals, does there appear to be a difference in the
16. The Excel file Blood Pressure shows diastolic blood pressure readings before and after a new medication.Find 95% confidence intervals for the variance for each of these groups. Based on these confidence intervals, would you conclude that the medication has kept the reading more stable?
15. If based on a sample of size 400, a political candidate found that 240 people would vote for him in a twoperson race, what is the 90% confidence interval for his proportion of votes? Can he be reasonably certain of victory? Find a 90% confidence interval and explain.
14. If, based on a sample of size 300, a political candidate found that 165 people would vote for him in a twoperson contest, can she be reasonably certain of victory?Find a 99% confidence interval and explain.
13. Average daily hotel room rates in two different American cities are given as follows:Average Room Rate Standard Deviation Sample Size City 1 $112 $9 10 City II $122 $12 12 If we cannot assume the variances to be equal, construct a 99% confidence interval for the two differences of the two means.
12. The Excel file Golfing Statistics provides data on the driving accuracy of 25 contestants. Develop a 90% confidence interval for driving accuracy.
11. The Excel file Restaurant Sales provides sample information on lunch, dinner, and delivery sales for a local Italian restaurant. Develop 95% confidence intervals for the mean of each of these variables, as well as for weekday and weekend sales. What conclusions can you reach?
10. Using the data in the worksheet Consumer Transportation Survey, develop 95% and 99% confidence intervals for the following:a. The mean hours per week that individuals spend in their vehiclesb. The average number of miles driven per weekc. The proportion of individuals who are satisfied with
9. Using the data in the Excel file MBA Student Survey, find 95% confidence intervals for the mean number of nights out per week and mean number of study hours per week by gender. Based on the confidence intervals, would you conclude that there is a difference in social and study habits between
8. Using the data in the Excel file Atlanta Airline Data , find and interpret 95% confidence intervals for the following:a. Mean difference between scheduled time of arrival and actual arrival time.b. Proportion of flights that arrive early.
7. A candy maker produces mints that have a label weight of 20 grams. Because of variations in the manufacturing process, the candies have a mean weight of 20 grams and a standard deviation of 0.25 grams, normally distributed.a. If a customer samples 25 mints, what is the probability that the mean
6. The speed of cars on a certain motorway has a normal distribution with mean 90 km/hr and a standard deviation of 12 km/hr. A radar unit is used to measure speeds of cars on this motorway. On a particular day, 9 cars are picked up at random on this motorway and their speeds are measured.a. What
5. A mechanical system needs 10 identical machine parts, and functions as long as all 10 parts are functioning.The lifetime of each of these machine parts has a normal distribution with a mean of 400 hours and a standard deviation of 12 hours. Devise and implement a sampling experiment for
4. Suppose that we conduct an experiment in which samples of size n are generated from a normal distribution having a known standard deviation s . If we compute the range of each sample, we can estimate the distribution of the statistic R / s . The expected value of this statistic is a factor that
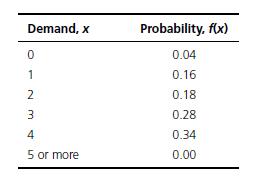
3. A bakery has the following probability distribution for the daily demand for its cakes.Using the first column of random numbers in Table 4.1, generate 20 samples from this distribution and construct a histogram of the results. Demand, x Probability, f(x) 0 1 2 0.04 0.16 0.18 3 0.28 4 0.34 5 or
2. Compute the mean and standard deviation of the runs scored by the 30 teams in major league baseball in the year 2010 (data given in the Excel file Major League Baseball ). Now draw a random sample of six teams using an appropriate random number generator in Excel. Compute the mean and standard
1. Data have to be collected to measure the effectiveness of an advertising campaign in a particular morning newspaper in an American city. For this situation, describe how one can collect samples using different sampling plans such as simple random sampling, stratified sampling, and cluster
20. What is a prediction interval and how does it differ from a confidence interval?
19. Explain how a confidence interval changes with changes in the level of confidence and sample size.
18. Under what circumstances can confidence intervals be applied to time‐series data?
17. Discuss how confidence intervals can help in making decisions. Provide some examples different from those in the chapter.
16. Summarize the different types of confidence intervals that one may construct, and provide a practical application for each.
15. When is it important to apply the finite population correction factor to the standard error when developing confidence intervals?
14. How does the t ‐distribution differ from the standard normal distribution?
13. What is a confidence interval? How do you properly interpret the level of confidence, 1 - a?
12. What do we mean by an unbiased estimator? Why is this important?
11. When is an estimator called an unbiased estimator?
10. Why is it always reasonable to use the normal distribution to solve probability questions regarding a sample mean based on a sample from any arbitrary distribution when the sample size is large? Which famous theorem justifies the use of the normal distribution in the above situation?
9. What is the standard error of the mean? How does it relate to the standard deviation of the population from which a sample is taken?
8. Explain the sampling distribution of the mean. What properties does it have?
7. Define a random number. How is it different from a random variate?
6. What is the difference between nonsampling error and sampling error? Why might each type of error occur?
5. Explain how the following sampling approaches work:a. Simple random samplingb. Systematic samplingc. Stratified samplingd. Cluster samplinge. Sampling from a continuous process
4. Describe the difference between subjective and probabilistic sampling methods. What are the advantages and disadvantages of each?
3. How does a frame differ from a target population?
2. What is a sampling plan and what elements should be included in one?
1. Explain the importance of sampling from a managerial perspective.
4. Estimate the mean and standard deviation for the data in the worksheet Process Capability. Using these values, and assuming that the process capability data are normal, find the probability that blade weights from this process will exceed 5.20. What is the probability that weights will be less
3. Do the data in the worksheet Process Capability appear to be normally distributed? (Construct a frequency distribution and histogram and use these to draw a conclusion.) If not, based on the histogram, what distribution might better represent the data?
2. What fraction of mowers fails the functional performance test using all the data in the worksheet Mower Test? Using this result, what is the probability of having x failures in the next 100 mowers tested, for x from 0 to 20?
1. What fraction of mowers fails for each of the 30 samples in the worksheet Mower Test? What distribution might be appropriate to model the failure of an individual mower? Using these data, estimate the sampling distribution of the mean, the overall fraction of failures, and the standard error of
36. Compute the joint probability distribution and marginal probabilities for age and educational status in the Excel file Census Education Data, and verify that these random variables are not statistically independent.Then, using the marginal probabilities, determine the joint probabilities that
Showing 1300 - 1400
of 2398
First
7
8
9
10
11
12
13
14
15
16
17
18
19
20
21
Last
Step by Step Answers