New Semester
Started
Get
50% OFF
Study Help!
--h --m --s
Claim Now
Question Answers
Textbooks
Find textbooks, questions and answers
Oops, something went wrong!
Change your search query and then try again
S
Books
FREE
Study Help
Expert Questions
Accounting
General Management
Mathematics
Finance
Organizational Behaviour
Law
Physics
Operating System
Management Leadership
Sociology
Programming
Marketing
Database
Computer Network
Economics
Textbooks Solutions
Accounting
Managerial Accounting
Management Leadership
Cost Accounting
Statistics
Business Law
Corporate Finance
Finance
Economics
Auditing
Tutors
Online Tutors
Find a Tutor
Hire a Tutor
Become a Tutor
AI Tutor
AI Study Planner
NEW
Sell Books
Search
Search
Sign In
Register
study help
business
essentials of statistics
Essentials Of Statistics 6th Edition Mario F Triola - Solutions
There are about 11,000 births each day in the United States, and the proportion of boys born in the United States is 0.512. Assume that each day, 100 births are randomly selected and the proportion of boys is recorded.a. What do you know about the mean of the sample proportions?b. What do you know
USA Today provided results from a poll of 1000 adults who were asked to identify their favorite pie. Among the 1000 respondents, 14% chose chocolate pie, and the margin of error was given as {4 percentage points. What important feature of the poll was omitted?
A bone mineral density test is used to identify a bone disease. The result of a bone density test is commonly measured as a z score, and the population of z scores is normally distributed with a mean of 0 and a standard deviation of 1. a. For a randomly selected subject, find the probability
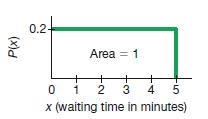
Greater than 3.00 minutesIn refer to the continuous uniform distribution depicted in Figure 6-2 and described in Example 1. Assume that a passenger is randomly selected, and find the probability that the waiting time is within the given range. (x)d 0.2- Area = 1 + 0 1 2 3 4 5 x (waiting time in
Data Set 4 “Births” in Appendix B includes birth weights of 400 babies. If we compute the values of sample statistics from that sample, which of the following statistics are unbiased estimators of the corresponding population parameters: sample mean; sample median; sample range; sample
Standing eye heights of men are normally distributed with a mean of 64.3 in. and a standard deviation of 2.6 in. (based on anthropometric survey data from Gordon, Churchill, et al.).a. If an eye recognition security system is positioned at a height that is uncomfortable for men with standing eye
Data Set 4 “Births” in Appendix B includes birth weights of 400 babies. If we compute the values of sample statistics from that sample, which of the following statistics are unbiased estimators of the corresponding population parameters: sample mean; sample median; sample range; sample
A geneticist is investigating the proportion of boys born in the world population. Because she is based in China, she obtains sample data from that country. Is the resulting sample proportion a good estimator of the population proportion of boys born worldwide? Why or why not?
In find the critical value Zα/2 that corresponds to the given confidence level.90%
a. If 1 adult female is randomly selected, find the probability that her pulse rate is less than 80 beats per minute.b. If 16 adult females are randomly selected, find the probability that they have pulse rates with a mean less than 80 beats per minute.c. Why can the normal distribution be used in
Less than 4.00 minutesIn refer to the continuous uniform distribution depicted in Figure 6-2 and described in Example 1. Assume that a passenger is randomly selected, and find the probability that the waiting time is within the given range. (x)d 0.2- Area = 1 + 0 1 2 3 4 5 x (waiting time in
In assume that scores on a bone mineral density test are normally distributed with a mean of 0 and a standard deviation of 1.a. Identify the values of μ and σ for the standard normal distribution.b. What do the symbols μx and σx represent?
a. If 1 adult female is randomly selected, find the probability that her pulse rate is greater than 70 beats per minute.b. If 25 adult females are randomly selected, find the probability that they have pulse rates with a mean greater than 70 beats per minute.c. Why can the normal distribution be
In find the critical value Zα/2 that corresponds to the given confidence level.99.5%
Between 2 minutes and 3 minutesIn refer to the continuous uniform distribution depicted in Figure 6-2 and described in Example 1. Assume that a passenger is randomly selected, and find the probability that the waiting time is within the given range. (x)d 0.2- Area = 1 + 0 1 2 3 4 5 x (waiting time
Between 2.5 minutes and 4.5 minutesIn refer to the continuous uniform distribution depicted in Figure 6-2 and described in Example 1. Assume that a passenger is randomly selected, and find the probability that the waiting time is within the given range. (x)d 0.2- Area = 1 + 0 1 2 3 4 5 x (waiting
With n = 20 guesses and p = 0.2 for a correct answer, find P(at least 6 correct answers).In do the following: If the requirements of np ≥ 5 and nq ≥ 5 are both satisfied, estimate the indicated probability by using the normal distribution as an approximation to the binomial distribution; if np
In assume that females have pulse rates that are normally distributed with a mean of 74.0 beats per minute and a standard deviation of 12.5 beats per minute (based on Data Set 1 “Body Data” in Appendix B). a. If 1 adult female is randomly selected, find the probability that her pulse rate
a. If 1 adult female is randomly selected, find the probability that her pulse rate is between 78 beats per minute and 90 beats per minute.b. If 16 adult females are randomly selected, find the probability that they have pulse rates with a mean between 78 beats per minute and 90 beats per minute.c.
Express 0.0434 < p < 0.217 in the form of p̂ + E.In express the confidence interval using the indicated format. (The confidence intervals are based on the proportions of red, orange, yellow, and blue M&Ms in Data Set 27 “M&M Weights” in Appendix B.)
Example 2 referred to an elevator with a maximum capacity of 4000 lb. When rating elevators, it is common to use a 25% safety factor, so the elevator should actually be able to carry a load that is 25% greater than the stated limit. The maximum capacity of 4000 lb becomes 5000 lb after it is
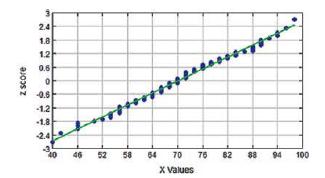
The accompanying normal quantile plot was constructed from the diastolic blood pressure levels of a sample of women. What does this graph suggest about diastolic blood pressure levels of women?In assume that scores on a bone mineral density test are normally distributed with a mean of 0 and a
Express 0.179 < p < 0.321 in the form of p̂ + E.In express the confidence interval using the indicated format. (The confidence intervals are based on the proportions of red, orange, yellow, and blue M&Ms in Data Set 27 “M&M Weights” in Appendix B.)
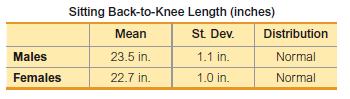
Find the probability that a male has a back-to-knee length less than 21 in.Inuse the data in the table below for sitting adult males and females (based on anthropometric survey data from Gordon, Churchill, et al.). These data are used often in the design of different seats, including aircraft
Express the confidence interval (0.0169, 0.143) in the form of p̂ – E < p < p̂ + E.In express the confidence interval using the indicated format. (The confidence intervals are based on the proportions of red, orange, yellow, and blue M&Ms in Data Set 27 “M&M Weights” in
Repeat Exercise 11 using medians instead of means.Data From Exercise 11a. After identifying the 16 different possible samples, find the mean of each sample, then construct a table representing the sampling distribution of the sample mean. In the table, combine values of the sample mean that are the
Express the confidence interval 0.270 ± 0.073 in the form of p̂ – E < p < p̂ + E.In express the confidence interval using the indicated format. (The confidence intervals are based on the proportions of red, orange, yellow, and blue M&Ms in Data Set 27 “M&M Weights” in
Find the probability that a female has a back-to-knee length greater than 24.0 in.Inuse the data in the table below for sitting adult males and females (based on anthropometric survey data from Gordon, Churchill, et al.). These data are used often in the design of different seats, including
Exercise 9 “Cookies”Data From Exercise 9The numbers of chocolate chips in Chips Ahoy (reduced fat) cookies, as listed inData Set 28 “Chocolate Chip Cookies” in Appendix B.In use the Excel, or StatCrunch) or a TI-83 , 84 Plus calculator to generate a normal quantile plot. Then determine
Repeat Exercise 11 using variances instead of means.Data from in Exercise 11a. After identifying the 16 different possible samples, find the mean of each sample, then construct a table representing the sampling distribution of the sample mean. In the table, combine values of the sample mean that
Exercise 10 “Ages of Best Actresses”Data From Exercise 10The ages of actresses at the times that they won Oscars, as listed in Data Set 14 “Oscar Winner Age” in Appendix B.In use the Excel, or StatCrunch) or a TI-83 , 84 Plus calculator to generate a normal quantile plot. Then determine
For males, find P90, which is the length separating the bottom 90% from the top 10%.Inuse the data in the table below for sitting adult males and females (based on anthropometric survey data from Gordon, Churchill, et al.). These data are used often in the design of different seats, including
Exercise 11 “Garbage”Data From Exercise 11The weights (pounds) of discarded yard waste, as listed in Data Set 31 “Garbage Weight” in Appendix B.In use the Excel, or StatCrunch) or a TI-83 , 84 Plus calculator to generate a normal quantile plot. Then determine whether the data come
Based on a study by Dr. P. Sorita at Indiana University, assume that 12% of us have green eyes. In a study of 650 people, it is found that 86 of them have green eyes.a. Find the probability of at least 86 people with green eyes among 650 randomly selected people.b. Is 86 people with green eyes
Exercise 12 “Diet Coke”Data From Exercise 12The weights (lb) of the contents in cans of Diet Coke, as listed in Data Set 26 “Cola Weights and Volumes” in Appendix B.In use the Excel, or StatCrunch) or a TI-83 , 84 Plus calculator to generate a normal quantile plot. Then determine
Assume that cans of Coke are filled so that the actual amounts are normally distributed with a mean of 12.00 oz and a standard deviation of 0.11 oz.a. Find the probability that a single can of Coke has at least 12.19 oz.b. The 36 cans of Coke in Data Set 26 “Cola Weights and Volumes” in
When Mendel conducted his famous genetics experiments with peas, one sample of offspring consisted of 929 peas, with 705 of them having red flowers. If we assume, as Mendel did, that under these circumstances, there is a 3/4 probability that a pea will have a red flower, we would expect that 696.75
Less than -1.23In assume that a randomly selected subject is given a bone density test. Those test scores are normally distributed with a mean of 0 and a standard deviation of 1. In each case, draw a graph, then find the probability of the given bone density test scores. If using technology instead
Less than –1.96In assume that a randomly selected subject is given a bone density test. Those test scores are normally distributed with a mean of 0 and a standard deviation of 1. In each case, draw a graph, then find the probability of the given bone density test scores. If using technology
The Ethan Allen tour boat capsized and sank in Lake George, New York, and 20 of the 47 passengers drowned. Based on a 1960 assumption of a mean weight of 140 lb for passengers, the boat was rated to carry 50 passengers. After the boat sank, New York State changed the assumed mean weight from 140 lb
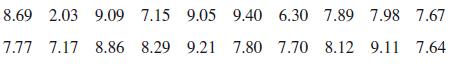
The following are the values of net worth (in thousands of dollars) of recent members of the executive branch of the U.S. government. Test these values for normality, then take the logarithm of each value and test for normality. What do you conclude? 237,592 16,068 15,350 11,712 7304 6037
Less than 1.28In assume that a randomly selected subject is given a bone density test. Those test scores are normally distributed with a mean of 0 and a standard deviation of 1. In each case, draw a graph, then find the probability of the given bone density test scores. If using technology instead
A sample of human brain volumes (cm3) is obtained from those listed in Data Set 8 “IQ and Brain Size” in Appendix B: 1027, 1029, 1034, 1070, 1079, 1079, 963, 1439.In use the given data values to identify the corresponding z scores that are used for a normal quantile plot, then identify the
Less than 2.56In assume that a randomly selected subject is given a bone density test. Those test scores are normally distributed with a mean of 0 and a standard deviation of 1. In each case, draw a graph, then find the probability of the given bone density test scores. If using technology instead
When she was 9 years of age, Emily Rosa did a science fair experiment in which she tested professional touch therapists to see if they could sense her energy field. She flipped a coin to select either her right hand or her left hand, and then she asked the therapists to identify the selected hand
Greater than 0.25In assume that a randomly selected subject is given a bone density test. Those test scores are normally distributed with a mean of 0 and a standard deviation of 1. In each case, draw a graph, then find the probability of the given bone density test scores. If using technology
The U.S. Air Force requires that pilots have heights between 64 in. and 77 in.a. Find the percentage of men meeting the height requirement.b. If the Air Force height requirements are changed to exclude only the tallest 2.5% of men and the shortest 2.5% of men, what are the new height
Greater than 0.18In assume that a randomly selected subject is given a bone density test. Those test scores are normally distributed with a mean of 0 and a standard deviation of 1. In each case, draw a graph, then find the probability of the given bone density test scores. If using technology
Greater than –2.00In assume that a randomly selected subject is given a bone density test. Those test scores are normally distributed with a mean of 0 and a standard deviation of 1. In each case, draw a graph, then find the probability of the given bone density test scores. If using technology
In a survey of 1002 people, 70% said that they voted in a recent presidential election (based on data from ICR Research Group). Voting records show that 61% of eligible voters actually did vote.a. Find a 98% confidence interval estimate of the proportion of people who say that they voted.b. Are the
The Gulfstream 100 is an executive jet that seats six, and it has a doorway height of 51.6 in.a. What percentage of adult men can fit through the door without bending?b. Does the door design with a height of 51.6 in. appear to be adequate? Why didn’t the engineers design a larger door?c. What
Greater than –3.05In assume that a randomly selected subject is given a bone density test. Those test scores are normally distributed with a mean of 0 and a standard deviation of 1. In each case, draw a graph, then find the probability of the given bone density test scores. If using technology
In a study of facial behavior, people in a control group are timed for eye contact in a 5-minute period. Their times are normally distributed with a mean of 184.0 seconds and a standard deviation of 55.0 seconds (based on data from “Ethological Study of Facial Behavior in Nonparanoid and Paranoid
Between 2.00 and 3.00In assume that a randomly selected subject is given a bone density test. Those test scores are normally distributed with a mean of 0 and a standard deviation of 1. In each case, draw a graph, then find the probability of the given bone density test scores. If using technology
Between 1.50 and 2.50In assume that a randomly selected subject is given a bone density test. Those test scores are normally distributed with a mean of 0 and a standard deviation of 1. In each case, draw a graph, then find the probability of the given bone density test scores. If using technology
Between and – 2.55 and – 2.00In assume that a randomly selected subject is given a bone density test. Those test scores are normally distributed with a mean of 0 and a standard deviation of 1. In each case, draw a graph, then find the probability of the given bone density test scores. If using
Between – 2.75 and – 0.75In assume that a randomly selected subject is given a bone density test. Those test scores are normally distributed with a mean of 0 and a standard deviation of 1. In each case, draw a graph, then find the probability of the given bone density test scores. If using
Between -2.00 and 2.00In assume that a randomly selected subject is given a bone density test. Those test scores are normally distributed with a mean of 0 and a standard deviation of 1. In each case, draw a graph, then find the probability of the given bone density test scores. If using technology
Between -3.00 and 3.00In assume that a randomly selected subject is given a bone density test. Those test scores are normally distributed with a mean of 0 and a standard deviation of 1. In each case, draw a graph, then find the probability of the given bone density test scores. If using technology
Find the sample size needed to estimate the percentage of California residents who are left-handed. Use a margin of error of three percentage points, and use a confidence level of 99%.a. Assume that p̂ and q̂ are unknown.b. Assume that based on prior studies, about 10% of Californians are
Between –1.00 and 5.00In assume that a randomly selected subject is given a bone density test. Those test scores are normally distributed with a mean of 0 and a standard deviation of 1. In each case, draw a graph, then find the probability of the given bone density test scores. If using
Between – 4.27 and 2.34In assume that a randomly selected subject is given a bone density test. Those test scores are normally distributed with a mean of 0 and a standard deviation of 1. In each case, draw a graph, then find the probability of the given bone density test scores. If using
Less than 4.55Between – 4.27 and 2.34In assume that a randomly selected subject is given a bone density test. Those test scores are normally distributed with a mean of 0 and a standard deviation of 1. In each case, draw a graph, then find the probability of the given bone density test scores. If
Greater than – 3.75In assume that a randomly selected subject is given a bone density test. Those test scores are normally distributed with a mean of 0 and a standard deviation of 1. In each case, draw a graph, then find the probability of the given bone density test scores. If using technology
In order to better plan for student resources, the chairperson of the mathematics department at Broward College wants to estimate the percentage of students who own a computer. If we want to estimate that percentage based on survey results, how many students must we survey in order to be 90%
Greater than 0In assume that a randomly selected subject is given a bone density test. Those test scores are normally distributed with a mean of 0 and a standard deviation of 1. In each case, draw a graph, then find the probability of the given bone density test scores. If using technology instead
A professor gives a test and the scores are normally distributed with a mean of 60 and a standard deviation of 12. She plans to curve the scores.a. If she curves by adding 15 to each grade, what is the new mean and standard deviation?b. Is it fair to curve by adding 15 to each grade? Why or why
Less than 0In assume that a randomly selected subject is given a bone density test. Those test scores are normally distributed with a mean of 0 and a standard deviation of 1. In each case, draw a graph, then find the probability of the given bone density test scores. If using technology instead of
Data Set 21 “Earthquakes” in Appendix B includes the depths (km) of the sources of 600 earthquakes. Use technology for the following.a. Find the mean and standard deviation of the 600 depths.b. Generate a histogram and normal quantile plot of the 600 depths. Does it appear that the depths are
1. Use the survey results to construct a 95% confidence a interval estimate of the percentage of all adults who know what Twitter is.2. Identify the margin of error for this survey.3. Explain why it would or would not be okay for a newspaper to make this statement: “Based on results from a recent
Why does the bootstrap method require sampling with replacement? What would happen if we used the methods of this section but sampled without replacement?
Repeat Exercise 7 “Freshman 15” using a confidence level of 90% for parts (a) And (b) And using 1000 bootstrap samples instead of the 10 that were given in Exercise 7.Data From Exercise 7Here is a sample of amounts of weight change (kg) of college students in their freshman year
A clinical trial was conducted to test the effectiveness of the drug zopiclone for treating insomnia in older subjects. After treatment with zopiclone, 16 subjects had a mean wake time of 98.9 min and a standard deviation of 42.3 min (based on data from “Cognitive Behavioral Therapy vs Zopiclone
You want to estimate σ for the population of waiting times for the Space Mountain ride in Walt Disney World. You want to be 99% confident that the sample standard deviation is within 1% of σ. Find the minimum sample size. Is this sample size practical?
When setting specifications of quarters to be accepted in a vending machine, you must estimate the standard deviation of the population of quarters in use. Find the minimum sample size needed to be 99% confident that the sample standard deviation is within 10% of the population standard deviation.
Data Set 1 “Body Data” in Appendix B includes weights of 153 randomly selected adult males, and those weights have a standard deviation of 17.65 kg. Because it is reasonable to assume that weights of male statistics students have less variation than weights of the population of adult males, let
In use these results from a USA Today survey in which 510 people chose to respond to this question that was posted on the USA Today website: “Should Americans replace passwords with biometric security (fingerprints, etc)?” Among the respondents, 53% said “yes.” We want to test the claim
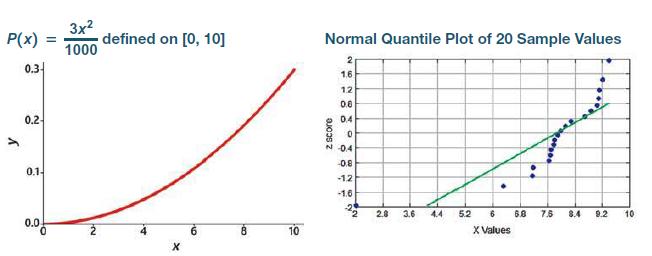
Consider the probability distribution defined by the formula where x can be any value between 0 and 10 inclusive (not just integers).The accompanying graph of this probability distribution shows that its shape is very far from the bell shape of a normal distribution. This probability distribution
The largest health experiment ever conducted involved a test of the Salk vaccine designed to protect children from the devastating effects of polio. The test included 201,229 children who were given the Salk vaccine, and 33 of them developed polio. The claim that the Salk vaccine is effective is
Data Set 26 “Cola Weights and Volumes” in Appendix B includes volumes (oz) of regular Coke. Based on that data set, assume that the cans are produced so that the volumes have a standard deviation of 0.115 oz. A new filling process is being tested for filling cans of cola, and a random sample of
If we are using the sample data from Exercise 1 for a t test of the claim that the population mean is greater than 90 sec, what does df denote, and what is its value?Data From Exercise 1Twelve different video games showing alcohol use were observed. The duration times of alcohol use were recorded,
Determine whether the given claim involves a hypothesis test that is left-tailed, twotailed, or right-tailed.a. p ≠ 0.5b. μ < 98.6°Fc. σ > 15 cm
If we use the same significance level to conduct the hypothesis test using the P-value method, the critical value method, and a confidence interval, which method is not equivalent to the other two?In use these results from a USA Today survey in which 510 people chose to respond to this question
Find the P-value in a test of the claim that the mean annual income of a CIA agent is greater than $81,623 (based on data from payscale.com) given that the test statistic is t = 1.304 for a sample of 40 CIA agents.
In identify the indicated values or interpret the given display. Use the normal distribution as an approximation to the binomial distribution, as described in Part 1 of this section. Use a 0.05 significance level and answer the following:a. Is the test two-tailed, left-tailed, or right-tailed?b.
In do the following:a. Express the original claim in symbolic form.b. Identify the null and alternative hypotheses.
The claim is that for Verizon data speeds at airports, the mean is μ = 14.00 mbps. The sample size is μ = 13 and the test statistic is t = –1.625In either use technology to find the P-value or use Table A-3 to find a range of values for the P-value.
True or false: In hypothesis testing, it is never valid to form a conclusion of supporting the null hypothesis.
True or false: The conclusion of “fail to reject the null hypothesis” has exactly the same meaning as “accept the null hypothesis.”
Repeat the preceding exercise using the pulse rates of women listed in Data Set 1 “Body Data” in Appendix B. For the sample of pulse rates of women, n = 147 and s = 12.5. See the accompanying JMP display that results from using the original list of pulse rates instead of the summary
True or false: If correct methods of hypothesis testing are used with a large simple random sample that satisfies the test requirements, the conclusion will always be true.
In a test of the claim that σ = 15 for the population of IQ scores of professional athletes, we find that the rightmost critical value is χ2R = 40.646. Is the leftmost critical χ2L value equal to –40.646?
Explain what is meant by the statements that the t test for a claim about μ is robust, but the χ2 test for a claim about σ2 is not robust.
Which of the following statements are true?a. When testing a claim about a population mean m, the P-value method, critical value method, and confidence interval method are all equivalent in the sense that they always yield the same conclusions.b. When testing a claim about a population proportion
Exercise 6 “Cell Phone”Data From Exercise 6Claim: Fewer than 95% of adults have a cell phone. In a Marist poll of 1128 adults, 87% said that they have a cell phone.In refer to the exercise identified. Make subjective estimates to decide whether results are significantly low or significantly
The proportion of adults who use the Internet is greater than 0.87.In provide statements that identify the type I error and the type II error that correspond to the given claim. (Although conclusions are usually expressed in verbal form, the answers here can be expressed with statements that
The proportion of people who require no vision correction is less than 0.25.In provide statements that identify the type I error and the type II error that correspond to the given claim. (Although conclusions are usually expressed in verbal form, the answers here can be expressed with statements
Among 460 overtime National Football League (NFL) games between 1974 and 2011, 252 of the teams that won the overtime coin toss went on to win the game. During those years, a team could win the coin toss and march down the field to win the game with a field goal, and the other team would never get
a. Assume that we want to use a 0.05 significance level to test the claim that p1 < p2. Which is better: A hypothesis test or a confidence interval?b. In general, when dealing with inferences for two population proportions, which two of the following are equivalent: confidence interval method;
The New York Times published an article about a study in which Professor Denise Korniewicz and other Johns Hopkins researchers subjected laboratory gloves to stress. Among 240 vinyl gloves, 63% leaked viruses. Among 240 latex gloves, 7% leaked viruses. See the accompanying display of the Statdisk
Showing 5000 - 5100
of 5165
First
38
39
40
41
42
43
44
45
46
47
48
49
50
51
52
Step by Step Answers