New Semester
Started
Get
50% OFF
Study Help!
--h --m --s
Claim Now
Question Answers
Textbooks
Find textbooks, questions and answers
Oops, something went wrong!
Change your search query and then try again
S
Books
FREE
Study Help
Expert Questions
Accounting
General Management
Mathematics
Finance
Organizational Behaviour
Law
Physics
Operating System
Management Leadership
Sociology
Programming
Marketing
Database
Computer Network
Economics
Textbooks Solutions
Accounting
Managerial Accounting
Management Leadership
Cost Accounting
Statistics
Business Law
Corporate Finance
Finance
Economics
Auditing
Tutors
Online Tutors
Find a Tutor
Hire a Tutor
Become a Tutor
AI Tutor
AI Study Planner
NEW
Sell Books
Search
Search
Sign In
Register
study help
business
essentials of statistics
Essentials Of Statistics 6th Edition Mario F Triola - Solutions
Carpal tunnel syndrome is a common wrist complaint resulting from a compressed nerve, and it is often the result of extended use of repetitive wrist movements, such as those associated with the use of a keyboard. In a randomized controlled trial, 73 patients were treated with surgery and 67 were
If we use the sample data in Exercise 2 for constructing a 99% confidence interval, what is the number of degrees of freedom that should be used for finding the critical value of tα/2? What is the critical value tα/2?Data From Exercise 2Listed below are body temperatures from five different
a. Exercise 2 includes a confidence interval. If you use the P-value method or the critical value method from Part 1 of this section to test the claim that women and men have the same mean hemoglobin levels, will the hypothesis tests and the confidence interval result in the same conclusion?b. In
When testing the claim that p1 = p2, a test statistic of z = -1.64 is obtained. Find the P-value for the hypothesis test.In use the following survey results: Randomly selected subjects were asked if they were aware that the Earth has lost half of its wildlife population during the past 50 years.
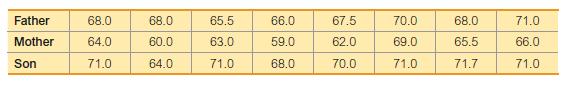
Construct a scatterplot of the father/son heights, then interpret it.In use the following heights (in.) The data are matched so that each column consists of heights from the same family.
1. Out-of-class activity The Chapter Problem is based on observations of cars with rear license plates only in states with laws that require both front and rear license plates. Work together in groups of three or four and collect data in your state. Use a hypothesis test to test the claim that in
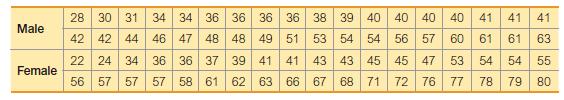
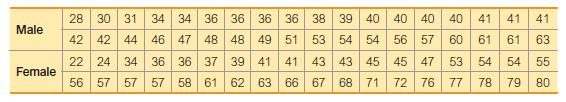
Use the same data from Exercise 6 and use the same scale to construct a boxplot of the braking reaction times of males and another boxplot for the braking reaction times of females. What do the boxplots suggest?Data From Exercise 6Listed below are sorted braking reaction times (in 1/10,000
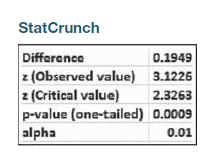
Use the sample data from Exercise 6 with a 0.01 significance level to test the claim that males and females have the same mean.Data from in Exercise 6Listed below are sorted braking reaction times (in 1>10,000 sec) for male and female subjects (based on data from the RT-2S Brake Reaction Time
Since the Hawk-Eye instant replay system for tennis was introduced at the U.S. Open in 2006, men challenged 2441 referee calls, with the result that 1027 of the calls were overturned. Women challenged 1273 referee calls, and 509 of the calls were overturned. We want to use a 0.05 significance level
Repeat Exercise 8 “The Spoken Word” using all of the data in the first two columns of Data Set 24 “Word Counts” in Appendix B.Data From Exercise 8Listed below are the numbers of words spoken in a day by each member of six different couples. The data are randomly selected from the first two
What is the difference between the regression equation ŷ = b0 + b1x and the regression equation y = β0 + β1x?
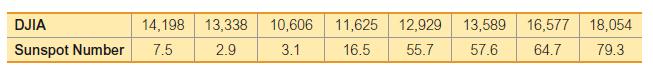
Use only the sunspot numbers for the following.a. Find the mean, median, range, standard deviation, and variance.b. Are the sunspot numbers categorical data or quantitative data?c. What is the level of measurement of the data? (nominal, ordinal, interval, ratio)Listed below are annual high values
In a trial designed to test the effectiveness of aspirin in preventing heart disease, 11,037 male physicians were treated with aspirin and 11,034 male physicians were given placebos. Among the subjects in the aspirin treatment group, 139 experienced myocardial infarctions (heart attacks). Among the
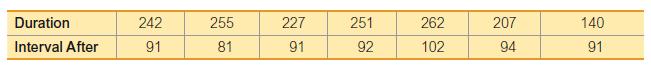
Repeat Exercise 14 using all of the paired duration>interval after times listed in Data Set 23.Data From Exercise 14Using the listed duration and interval after times, find the best predicted “interval after” time for an eruption with a duration of 253 seconds. How does it compare to an
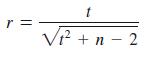
The efficiency of the rank correlation test is 0.91, which indicates that with all other factors being the same, rank correlation requires 100 pairs of sample observations to achieve the same results as 91 pairs of observations with the parametric test using linear correlation, assuming that the
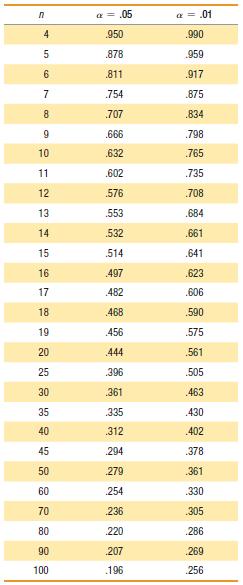
Table A-5 lists critical values of r for selected values of n and a. Table A-5More generally, critical r values can be found by using the formula where the t value is found from the table of critical t values (Table A-3) assuming a two tailed case with n –2 degrees of freedom. Use the
Use the frequency distribution from Exercise 11 in Section 2-1 on page 49 to construct a histogram. Does it appear to be the graph of data from a population with a normal distribution?In construct the histograms and answer the given questions.Data From Section 2.1 Exercise 11Listed below are sorted
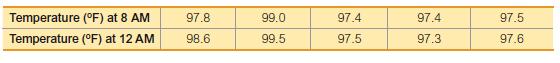
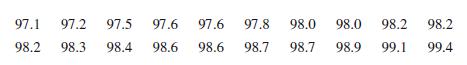
Construct a stemplot of the body temperatures listed in Exercise 1. Are there any outliers?Data From Exercise 1Construct a frequency distribution of the 20 body temperatures (oF) listed below. (These data are from Data Set 3 “Body Temperatures” in Appendix B.) Use a class width of 0.5oF and a
Use the frequency distribution from Exercise 12 in Section 2-1 on page 49 to construct a histogram. Does the histogram appear to be skewed? If so, identify the type of skewness.In construct the histograms and answer the given questions.Data From Section 2.1 Exercise 12Listed below are the F-scale
During the last presidential election, CNN conducted an exit poll in which specific polling stations were randomly selected and all voters were surveyed as they left the premises.In identify which of these types of sampling is used: random, systematic, convenience, stratified, or cluster.
Blood lead levels of low, medium, and high used to describe the subjects in Data Set 7 “IQ and Lead” in Appendix BIn determine which of the four levels of measurement (nominal, ordinal, interval, ratio) is most appropriate.
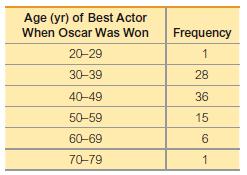
Refer to the frequency distribution from Exercise 5.Data From Exercise 5In Exercises 9 and 10, using a loose interpretation of the criteria for determining whether a frequency distribution is approximately a normal distribution, determine whether the given frequency distribution is approximately a
In an investigation of a relationship between systolic blood pressure and diastolic blood pressure of adult females, which of the following graphs is most helpful: histogram; pie chart; scatterplot; stemplot; dotplot?
Refer to the frequency distribution from Exercise 6.Data From Exercise 6In Exercises 9 and 10, using a loose interpretation of the criteria for determining whether a frequency distribution is approximately a normal distribution, determine whether the given frequency distribution is approximately a
In Florida’s Play 4 lottery game, four digits between 0 and 9 inclusive are randomly selected each day. We normally expect that each of the 10 different digits will occur about 1/10 of the time, and an analysis of last year’s results shows that this did happen. Because the results are what we
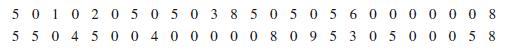
Use the frequency distribution from Exercise 17 in Section 2-1 on page 49 to construct a histogram. What can be concluded from the distribution of the digits? Specifically, do the heights appear to be reported or actually measured?In construct the histograms and answer the given questions.Data From
Use the frequency distribution from Exercise 11 in Section 2-1 on page 49 to construct a frequency polygon. Does the graph suggest that the distribution is skewed? If so, how?In construct the frequency polygons.Data From Section 2.1 Exercise 11Listed below are sorted duration times (seconds) of
Use the frequency distribution from Exercise 13 in Section 2-1 on page 49 to construct a histogram. Does the histogram appear to be skewed? If so, identify the type of skewness.In construct the histograms and answer the given questions.Data From Section 2.1 Exercise 13Refer to Data Set 25 “Fast
Use the frequency distribution from Exercise 14 in Section 2-1 on page 49 to construct a histogram. Using a strict interpretation of the criteria for being a normal distribution, does the histogram appear to depict data from a population with a normal distribution?In construct the histograms and
Use the frequency distribution from Exercise 12 in Section 2-1 on page 49 to construct a frequency polygon. Does the graph suggest that the distribution is skewed? If so, how?In construct the frequency polygons.Data From Section 2.1 Exercise 12Tornadoes Listed below are the F-scale intensities of
Use the frequency distribution from Exercise 15 in Section 2-1 on page 49 to construct a histogram. Does the histogram appear to be skewed? If so, identify the type of skewness.In construct the histograms and answer the given questions.Data From Section 2.1 Exercise 15Refer to Data Set 25 “Fast
Use the frequency distribution from Exercise 16 in Section 2-1 on page 49 to construct a histogram. In using a strict interpretation of the criteria for being a normal distribution, does the histogram appear to depict data from a population with a normal distribution?In construct the histograms and
Use the frequency distribution from Exercise 18 in Section 2-1 on page 49 to construct a histogram. What can be concluded from the distribution of the digits? Specifically, do the heights appear to be reported or actually measured?In construct the histograms and answer the given questions.Data From
Refer to Data Set 24 “Word Counts” in Appendix B, which includes counts of words spoken by males and females. That data set includes 12 columns of data, but first stack all of the male word counts in one column and stack all of the female word counts in another column. Then proceed to generate
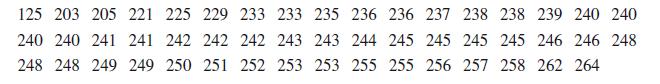
Listed below is a sample of duration times (seconds) of eruptions of the Old Faithful geyser. Use the range rule of thumb to estimate the value of the standard deviation of all duration times, and compare the result to the standard deviation of 33.7 seconds found from a sample of 2634 duration
The ACT test is used to assess readiness for college. In a recent year, the mean ACT score was 21.1 and the standard deviation was 5.1. Identify the ACT scores that are significantly low or significantly high. The ACT test is used to assess readiness for college. In a recent year, the mean ACT
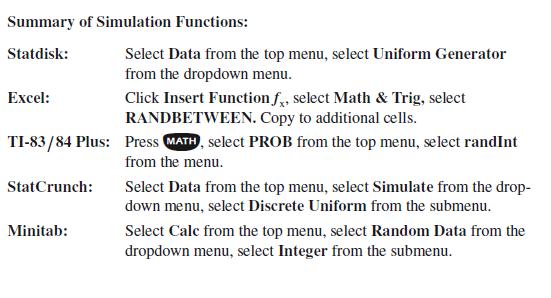
Simulations Calculating probabilities are sometimes painfully difficult, but simulations provide us with a very practical alternative to calculations based on formal rules. A simulation of a procedure is a process that behaves the same way as the procedure so that similar results are produced.
Exercise 25 “Tornadoes”In refer to the data in the indicated exercise. After finding the range of the data, use the range rule of thumb to estimate the value of the standard deviation. Compare the result to the standard deviation computed with all of the data.Data From Exercise Use the
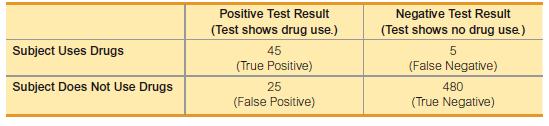
Find the probability of selecting someone who uses drugs. Does the result appear to be reasonable as an estimate of the “prevalence rate” described in the Chapter Problem?In refer to the sample data in Table 4-1, which is included with the Chapter Problem. Assume that 1 of the 555 subjects
Which of the following are probabilities? 0 3/5 5/3 -0.25 250% 7:3 1 50-50 5:1 0.135 2.017
Exercise 26 “Earthquakes”In refer to the data in the indicated exercise. After finding the range of the data, use the range rule of thumb to estimate the value of the standard deviation. Compare the result to the standard deviation computed with all of the data.Data From Exercise 26Use the
Exercise 27 “Body Temperatures”In refer to the data in the indicated exercise. After finding the range of the data, use the range rule of thumb to estimate the value of the standard deviation. Compare the result to the standard deviation computed with all of the data.Data From Exercise
1. False Positive Based on the results in the table, find the probability that a subject is not a smoker, given that the test result is positive.2. True Positive Based on the results in the table, find the probability that a subject smokes, given that the test result is positive. 3. False
1. Out-of-class activity Divide into groups of three or four and create a new carnival game. Determine the probability of winning. Determine how much money the operator of the game can expect to gain each time the game is played.2. In-class activity Divide into groups of three or four and use coin
A presidential candidate plans to begin her campaign by visiting the capitals of 5 of the 50 states. If the five capitals are randomly selected without replacement, what is the probability that the route is Sacramento, Albany, Juneau, Hartford, and Bismarck, in that order?In express all
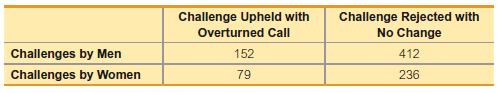
In a recent U.S. Open tennis tournament, there were 879 challenges made by singles players, and 231 of them resulted in referee calls that were overturned. The accompanying table lists the results by gender.a. If 1 of the 879 challenges is randomly selected, what is the probability that it resulted
Currently, the rate for new cases of diabetes in a year is 3.4 per 1000 (based on data from the Centers for Disease Control and Prevention). When testing for the presence of diabetes, the Portland Diagnostics Laboratory saves money by combining blood samples for tests. The combined sample tests
MicroSort’s YSORT gender selection technique is designed to increase the likelihood that a baby will be a boy. At one point before clinical trials of the YSORT gender selection technique were discontinued, 291 births consisted of 239 baby boys and 52 baby girls (based on data from the Genetics
Overbooking Flights American Airlines Flight 171 from New York’s JFK airport to LAX airport in Los Angeles uses an Airbus A321 aircraft with 189 seats available for passengers. American Airlines can overbook by accepting more reservations than there are seats available.If the flight is not
Gregor Mendel conducted original experiments to study the genetic traits of pea plants. In 1865 he wrote “Experiments in Plant Hybridization,” which was published in Proceedings of the Natural History Society. Mendel presented a theory that when there are two inheritable traits, one of them
Is a probability distribution defined if the only possible values of a random variable are 0, 1, 2, 3, and P(0) = P(1) = P(2) = P(3) = 1/3?
Assume that we want to find the probability that when five consumers are randomly selected, exactly two of them are comfortable with delivery by drones. Also assume that 42% of consumers are comfortable with the drones (based on a Pitney Bowes survey). Identify the values of n, x, p, and q.
During a recent 64-year period, New Mexico had 153 tornadoes that measured 1 or greater on the Fujita scale. Let the random variable x represent the number of such tornadoes to hit New Mexico in one year, and assume that it has a Poisson distribution. What is the mean number of such New Mexico
Find the mean and standard deviation for the numbers of adults in groups of five who have credit cards. In Exercises 1–5, assume that 74% of randomly selected adults have a credit card (based on results from an AARP Bulletin survey). Assume that a group of five adults is randomly selected.
For Formula 5-9, what does P(0) represent? Simplify Formula 5-9 for the case in which x = 0.
In refer to the given values, then identify which of the following is most appropriate: discrete random variable, continuous random variable, or not a random variable.a. Exact weights of the next 100 babies born in the United Statesb. Responses to the survey question “Which political party do you
Based on the table, the standard deviation is 0.9 flight. What is the variance? Include appropriate units.In use the following: Five American Airlines flights are randomly selected, and the table in the margin lists the probabilities for the number that arrive on time (based on data from the
Find the probability that the number x of correct answers is exactly 7.In assume that random guesses are made for eight multiple choice questions on an SAT test, so that there are n = 8 trials, each with probability of success (correct) given by p = 0.20. Find the indicated probability for the
Find the probability that the number x of correct answers is at least 4.In assume that random guesses are made for eight multiple choice questions on an SAT test, so that there are n = 8 trials, each with probability of success (correct) given by p = 0.20. Find the indicated probability for the
Find the probability of no correct answers.In assume that random guesses are made for eight multiple choice questions on an SAT test, so that there are n = 8 trials, each with probability of success (correct) given by p = 0.20. Find the indicated probability for the number of correct answers.
Find the probability that at least one answer is correct.In assume that random guesses are made for eight multiple choice questions on an SAT test, so that there are n = 8 trials, each with probability of success (correct) given by p = 0.20. Find the indicated probability for the number of correct
If 8 adult smartphone users are randomly selected, find the probability that exactly 6 of them use their smartphones in meetings or classes.In assume that when adults with smartphones are randomly selected, 54% use them in meetings or classes (based on data from an LG Smartphone survey).
If 20 adult smartphone users are randomly selected, find the probability that exactly 15 of them use their smartphones in meetings or classes.In assume that when adults with smartphones are randomly selected, 54% use them in meetings or classes (based on data from an LG Smartphone survey).
If 10 adult smartphone users are randomly selected, find the probability that at least 8 of them use their smartphones in meetings or classes.In assume that when adults with smartphones are randomly selected, 54% use them in meetings or classes (based on data from an LG Smartphone survey).
It is estimated that worldwide, 1% of those aged 15–49 are infected with the human immunodeficiency virus (HIV) (based on data from the National Institutes of Health). In tests for HIV, blood samples from 36 people are combined. What is the probability that the combined sample tests positive for
Showing 5100 - 5200
of 5165
First
38
39
40
41
42
43
44
45
46
47
48
49
50
51
52
Step by Step Answers