New Semester
Started
Get
50% OFF
Study Help!
--h --m --s
Claim Now
Question Answers
Textbooks
Find textbooks, questions and answers
Oops, something went wrong!
Change your search query and then try again
S
Books
FREE
Study Help
Expert Questions
Accounting
General Management
Mathematics
Finance
Organizational Behaviour
Law
Physics
Operating System
Management Leadership
Sociology
Programming
Marketing
Database
Computer Network
Economics
Textbooks Solutions
Accounting
Managerial Accounting
Management Leadership
Cost Accounting
Statistics
Business Law
Corporate Finance
Finance
Economics
Auditing
Tutors
Online Tutors
Find a Tutor
Hire a Tutor
Become a Tutor
AI Tutor
AI Study Planner
NEW
Sell Books
Search
Search
Sign In
Register
study help
business
foundations macroeconomics
Foundations of Macroeconomics 8th edition Robin Bade, Michael Parkin - Solutions
A net exports deficit will become a surplus if ______. A. The government budget deficit is turned into a surplus and the private sector has a surplus B. The private sector surplus adjusts to equal the government sector deficit C. Private saving and government saving exceed
The quantity of U.S. dollars demanded in the foreign exchange market increases if ______. A. The value of U.S. imports increases B. Traders expect the future exchange rate to rise C. The U.S. interest rate rises relative to those in other countries D. The U.S. dollar
The supply of U.S. dollars in the foreign exchange market increases if ______. A. The value of U.S. imports increases B. The U.S. interest rate differential decreases C. The U.S. dollar depreciates against other currencies D. The U.S. dollar is expected to appreciate against
Purchasing power parity ______A. Holds if the price of a good is the same number of euros, pounds, or dollars B. Means that the value of the euro, the pound, and the dollar are equal C. Always holds because exchange rates adjust automatically D. Implies that international trade is
To keep the yuan-U.S. dollar exchange rate constant, ______. A. The Fed agrees not to sell U.S. dollars in the foreign exchange market B. The People’s Bank of China buys U.S. dollars C. The Fed and the People’s Bank agree on the value of the exchange rate D. The Fed does
Who in the United States loses from this trade in roses and would lobby for a restriction on the quantity of imported roses? Suppose that the U.S. government put a tariff on rose imports. Show on your graph the effect of the tariff on U.S. consumers and U.S. producers. Show the government’s
Who in the United States loses from free trade in shoes with Brazil? Explain why.
The world price of a pair of shoes is $20. Explain how consumers and producers in the United States gain or lose as a result of international trade. On the graph, show the change in U.S. purchases, production, and the price of a pair of shoes.
The world price of a pair of shoes is $20. Explain how consumers and producers in Brazil gain or lose as a result of international trade. Show the change in Brazil’s purchases, production, and price of a pair of shoes.
Explain who in the United States gains and who loses from restrictions on steel imports. How do you expect the prices of automobiles and office towers to be affected?U.S. steelmakers seek antidumping action, steelmakers want the United States to put restrictions on imports from five nations,
What is dumping? Who in the United States loses from China’s dumping of steel?U.S. steelmakers seek anti dumping action, steelmakers want the United States to put restrictions on imports from five nations, alleging unfair pricing of steel for the automobile and construction industries.
Explain what an anti dumping tariff is. What argument might U.S. steelmakers use to get the government to raise the tariff on steel imports?U.S. steelmakers seek antidumping action, steelmakers want the United States to put restrictions on imports from five nations, alleging unfair pricing of steel
The supply of roses in the United States is made up of U.S. grown roses and imported roses. Draw a graph to illustrate the U.S. rose market with free international trade. On your graph, mark the price of roses and the quantities of roses bought, produced, and imported into the United States.
Does the Fed face a tradeoff in the short run? Explain why or why not.The U.S. economy is at full employment when the world price of oil begins to rise sharply. Short-run aggregate supply decreases.
Explain how the U.S. price level and real GDP will change in the long run if the Fed takes monetary policy actions that are consistent with its objectives as set out in the Federal Reserve Act of 2000.The U.S. economy is at full employment when the world price of oil begins to rise sharply.
Explain how the U.S. price level and real GDP will change in the short run.The U.S. economy is at full employment when the world price of oil begins to rise sharply. Short-run aggregate supply decreases.
Explain whether the Fed faces a tradeoff in the short run.Suppose that the U.S. economy is at full employment when strong economic growth in Asia increases the demand for U.S.-produced goods and services.
Explain how the U.S. price level and real GDP will change in the short run.Suppose that the U.S. economy is at full employment when strong economic growth in Asia increases the demand for U.S.-produced goods and services.
Explain how the U.S. price level and real GDP will change in the long run if the Fed takes monetary policy actions that are consistent with its objectives as set out in the Federal Reserve Act of 2000.Suppose that the U.S. economy is at full employment when strong economic growth in Asia increases
How do healthcare programs and Social Security benefits drive spending and the deficit and how do they create fiscal imbalance and generational imbalance?CBO expects higher long-term deficits, the Congressional Budget Office (CBO) says the national debt is on an upward path and will hit 122 percent
If the government decided to slow the growth of debt by cutting transfer payments and raising taxes by the same amount, how would this fiscal policy influence the budget deficit and real GDP?CBO expects higher long-term deficits, the Congressional Budget Office (CBO) says the national debt is on an
Explain why the national debt does not measure the federal government’s true indebtedness. How does the nation’s fiscal imbalance provide a more accurate account of government’s debt?CBO expects higher long-term deficits, the Congressional Budget Office (CBO) says the national debt is on an
Aggregate supply increases when ________.A. The price level risesB. The money wage rate fallsC. Consumption increasesD. The money price of oil increases
When potential GDP increases, _______A. Aggregate demand increasesB. Aggregate supply increasesC. Both aggregate demand and aggregate supply increaseD. The price level rises
The quantity of real GDP demanded increases if _______.A. The buying power of money increasesB. The money wage rate risesC. The price level fallsD. The nominal interest rate falls
An increase in expected future income increases ________.A. Consumption expenditure, which increases current aggregate demandB. Investment, which increases current aggregate supplyC. The demand for money, which decreases current aggregate demandD. Future consumption expenditure and has no effect on
Macroeconomic equilibrium occurs when the quantity of real GDP _______ equals the quantity of _______.A. Demanded; real GDP suppliedB. Demanded; potential GDPC. Supplied; potential GDPD. Demanded; real GDP supplied and potential GDP
If the economy is at full employment and the Fed increases the quantity of money, _______.A. Aggregate demand increases, a recessionary gap appears, and the money wage rate starts to riseB. Aggregate supply increases, the price level starts to fall, and an expansion beginsC. Aggregate demand
Over the past decade, the demand for goods produced in China has brought a sustained increase in demand for China’s exports that has outstripped the growth of supply. As a result, China has experienced a _______.A. Period of stable prices and sustained economic growthB. Rising price level and
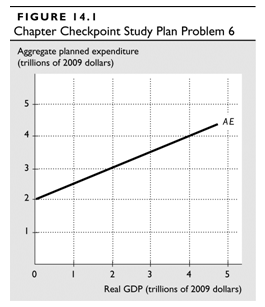
Figure 14.1 shows aggregate planned expenditure when the price level is 100. When the price level increases to 110, aggregate planned expenditure changes by $0.5 trillion. What is the quantity of real GDP demanded when the price level is 100 and 110? FIGURE 14.1 Chapter Checkpoint Study Plan
Why do multiplier estimates differ? What conditions would be consistent with a large multiplier?
The output gap in the second quarter of 2009 was $0.8 trillion. How much fiscal stimulus would be required to close the output gap if the multiplier was as large as the Obama team believes? How much fiscal stimulus would be required if the multiplier was a large as Robert Barro believes?
The consumption function shows how an increase in _______ influences _________.A. Income; households’ aggregate planned expenditureB. Nominal GDP; consumption expenditureC. Disposable income; consumption expenditureD. Consumption as a fraction of income; real GDP
The marginal propensity to consume tells us by how much _______ changes when _______ changes.A. Consumption expenditure; wealthB. The real interest rate; planned consumptionC. Expected future income; the percentage of income spentD. Consumption expenditure; disposable income
Induced expenditure includes ________ .A. Consumption expenditure, government expenditure, and exportsB. Investment, exports, and importsC. Consumption expenditure and importsD. Consumption expenditure, investment, and government expenditure
The aggregate planned expenditure curve ________ increases.A. Slopes upward because induced expenditure increases as incomeB. Is horizontal because autonomous expenditure is constant when incomeC. Shifts upward if induced expenditure increases as incomeD. Slopes upward because autonomous expenditure
If real GDP _______ planned expenditure, the economy converges to equilibrium expenditure because inventories _________ and firms increase production.A. Exceeds; pile upB. Exceeds; are run downC. Is less than; are run downD. Is less than; pile up
The multiplier equals ____________ divided by _________.A. The marginal propensity to consume; autonomous expenditureB. 1; (1 – Slope of the AE curve)C. 1; Slope of the AE curveD. Slope of the AE curve; the marginal propensity to consume
The multiplier will increase if the marginal propensity to consume ______ or the marginal tax rate ______.A. Increases; decreasesB. Increases; increasesC. Decreases; increasesD. Decreases; decreases
A rise in the price level shifts the AE curve ______.A. Upward and creates a movement up along the AD curveB. Downward and creates a movement up along the AD curveC. Upward and shifts the AD curve rightwardD. Downward and shifts the AD curve leftward
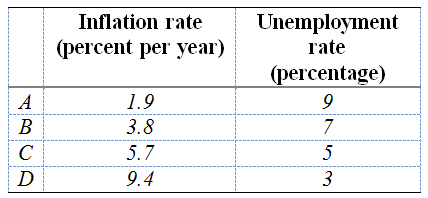
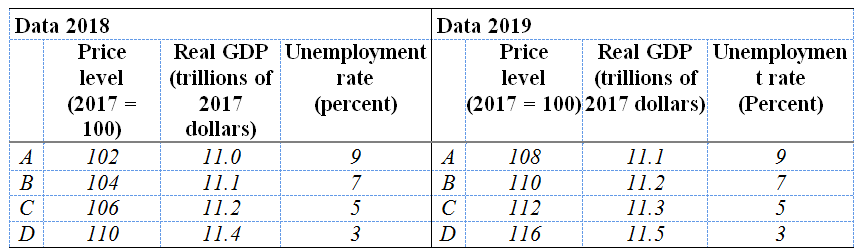
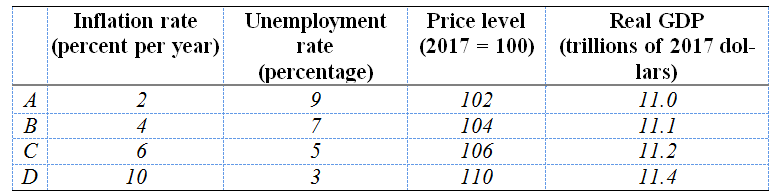
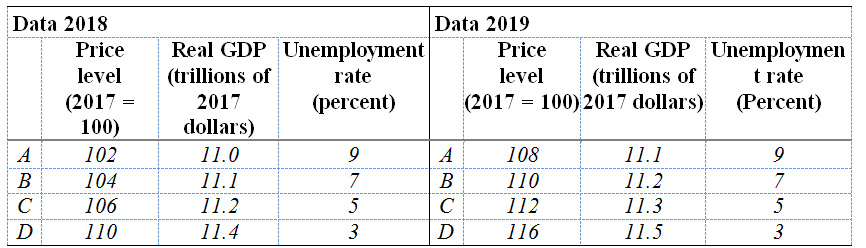
In 2019, the outcome turned out to be row C of the left side of the table. Plot the short-run Phillips curve for 2019 and mark the points A, B, C, and D that correspond to the data in the right side of the table.The left part of the table describes four situations that might arise in 2018,
Compare the short-run Phillips curve of 2019 with that of 2018. Data 2018 Price level (2017 100) Data 2019 Real GDP Unemployment (trillions of Real GDP Unemploymen Price level (trillions of rate t rate (2017 = 100) 2017 dollars) (percent) (Percent) 2017 dollars) 102 11.0 108 11.1 104 B 11.1 B 110
Explain the effects of a global recession on the U.S. macroeconomic equilibrium in the short run. Explain the adjustment process that restores the economy to full employment.
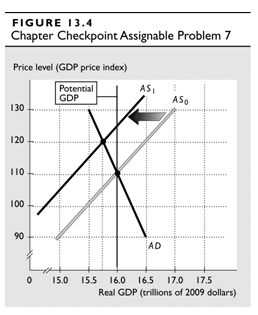
Suppose that the world price of oil rises. On an AS–AD graph, show the effect of the world oil price rise on U.S. macroeconomic equilibrium in the short run. Explain the adjustment process that restores the economy to full employment.
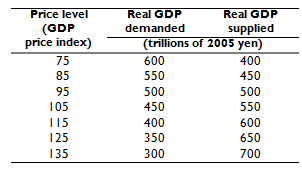
The table sets out the aggregate demand and aggregate supply schedules in Japan. Potential GDP is 600 trillion yen. What is the short-run macroeconomic equilibrium? Does Japan have an inflationary gap or a recessionary gap and what is its magnitude? Price level (GDP price index) Real GDP Real GDP
How would such an action influence aggregate supply?
How would such an action influence aggregate demand?
Suppose that the United States is at full employment. Then the federal government cuts taxes, and all other influences on aggregate demand remain the same. Explain the effect of the tax cut on aggregate demand in the short run.
Suppose that the United States is at full employment. Explain the effect of each of the following events on aggregate supply: Union wage settlements push the money wage rate up by 10 percent.The price level increases.Potential GDP increases.
What, according to the mainstream theory of the business cycle, is the most common source of recession: a decrease in aggregate demand, a decrease in aggregate supply, or both? Which is the most likely component of aggregate demand to start a recession? How does the aggregate demand multiplier
Read Eye on the Business Cycle on p. 347. What caused the 2008–2009 recession and how do we know that a decrease in aggregate supply played a role?
€œBrexit€ expected to rattle U.S. economy, the United Kingdom vote to leave the European Union (known as Brexit) is expected to affect the U.S. economy by driving up the value of the dollar. But it is not thought that Brexit alone will shrink the U.S. economy.Explain how a high
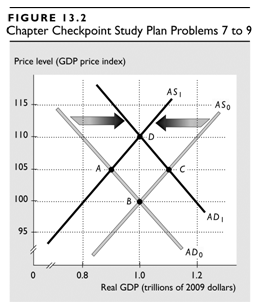
Some events change aggregate demand from AD0 to AD1and aggregate supply from AS0to AS1. What is the new macroeconomic equilibrium?Use Figure 13.2 to work Problem. Initially, the economy is at point B. FIGURE 13.2 Chapter Checkpoint Study Plan Problems 7 to 9 Price level (GDP price index) AS, 115
Some events change aggregate supply from AS0to AS1. Describe two possible events. What is the new equilibrium point? If potential GDP is $1 trillion, does the economy have an inflationary gap, a recessionary gap, or no gap?Use Figure 13.2 to work Problem. Initially, the economy is at point B.
Some events change aggregate demand from AD0to AD1. Describe two possible events. What is the new equilibrium point? If potential GDP is $1 trillion, describe the type of macroeconomic equilibrium.Use Figure 13.2 to work Problem. Initially, the economy is at point B. FIGURE 13.2 Chapter Checkpoint
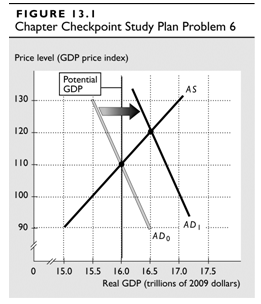
Explain the effect of the Fed€™s action that increases the quantity of money on the macroeconomic equilibrium in the short run. Explain the adjustment process that returns the economy to full employment. FIGURE 13.I Chapter Checkpoint Study Plan Problem 6 Price level (GDP price index)
Suppose that the U.S. economy has a recessionary gap and the world economy goes into an expansion. Explain the effect of the expansion on U.S. real GDP and unemployment in the short run.
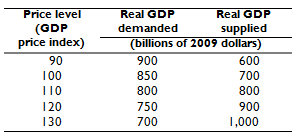
The table sets out an economy€™s aggregate demand and aggregate supply schedules. What is the macroeconomic equilibrium? If potential GDP is $600 billion, what is the type of macroeconomic equilibrium? Explain how real GDP and the price level will adjust in the long run. Price level (GDP
The United States is at full employment when the Fed cuts the quantity of money, other things remaining the same. Explain the effect of the cut in the quantity of money on aggregate demand in the short run.
Explain the effect of each of the following events on the quantity of U.S. real GDP demanded and the demand for U.S. real GDP:The world economy goes into a strong expansion. The U.S. price level rises.Congress raises income taxes.
As more people in India have access to higher education, explain how potential GDP and aggregate supply will change in the long run.
The costs of inflation do not include _______. A. The cost of running around to compare prices at different outlets B. The increased opportunity cost of holding money C. The tax on money held by individuals and businesses D. An increase in saving and investment
In the long run with a constant velocity of circulation, the inflation rate ______. A. Is constant and equals the money growth rate B. Equals the money growth rate minus the growth rate of real GDP C. Equals the growth rate of real GDP minus the growth rate of money D. Is
If the quantity theory of money is correct and other things remain the same, an increase in the quantity of money increases _______. A. Nominal GDP and the velocity of circulation B. The price level and potential GDP C. Real GDP D. Nominal GDP and the price level
In the long run, money market equilibrium determines the _______. A. real interest rate B. price level C. nominal interest rate D. economic growth rate
If the Fed increases the quantity of money, people will be holding ________. A. Too much money, so they buy bonds and the interest rate rises B. Too much money, so they buy bonds and the interest rate falls C. The quantity of money they demand and banks will hold more money D.
The quantity of money demanded increases if _______. A. The supply of money increases B. The nominal interest rate falls C. Banks increase the interest rate on deposits D. The price of a bond falls
The opportunity cost of holding money _______. A. Is determined by the inflation rate B. Is zero because money earns no interest C. Equals the nominal interest rate on bonds D. Equals the real interest rate on bonds
Holding money provides a benefit ________. A. Because it is a means of payment B. Because its opportunity cost is low C. Which is constant no matter how much money is held D. Because most money is in bank deposits
If the money growth rate and real GDP growth rate of the 2010s are maintained and if the velocity growth rate is zero, will the inflation rate rise to 3 percent as predicted by Martin Feldstein?
Sara has $200 in currency and $2,000 in a bank account on which the bank pays no interest. The inflation rate is 2 percent a year. Calculate the amount of inflation tax that Sara pays in a year.
If the velocity of circulation is constant, real GDP is growing at 3 percent a year, the real interest rate is 2 percent a year, and the nominal interest rate is 7 percent a year, calculate the inflation rate, the growth rate of money, and the growth rate of nominal GDP.
Plot the short-run Phillips curve and aggregate supply curve for 2018 and mark the points A, B, C, and D on each curve that correspond to the data in the left part of the table.The left part of the table describes four situations that might arise in 2018, depending on the level of aggregate demand.
Explain the process by which a decrease in durable goods orders at a constant price level changes equilibrium expenditure and real GDP.U.S. durable goods orders slump most in three years, the Commerce Department reported that orders for U.S. durable goods fell in January by the most in three years.
What determines the decrease in aggregate demand resulting from a decrease in durable goods orders?U.S. durable goods orders slump most in three years, the Commerce Department reported that orders for U.S. durable goods fell in January by the most in three years. Orders for commercial aircraft and
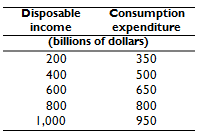
Calculate saving at each level of disposable income. Over what range of disposable income does consumption expenditure exceed disposable income? Calculate autonomous consumption expenditure.The table shows disposable income and consumption expenditure in an economy. Use the table to work Problem.
Calculate the marginal propensity to consume. At what level of disposable income will saving be zero? If expected future income increases, in which direction will the consumption function change?The table shows disposable income and consumption expenditure in an economy. Use the table to work
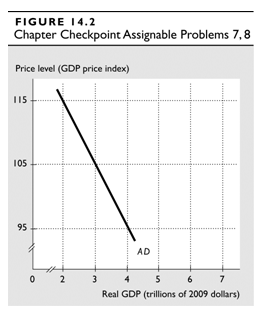
Compare the shift of the AD curve with the $1 trillion increase in investment. Explain the magnitude of the shift of the AD curve.The figure shows the aggregate demand curve in an economy. Suppose that aggregate planned expenditure increases by $0.75 trillion for each $1 trillion increase in real
If investment increases by $1 trillion, calculate the change in the quantity of real GDP demanded if the price level is constant at 105.The figure shows the aggregate demand curve in an economy. Suppose that aggregate planned expenditure increases by $0.75 trillion for each $1 trillion increase in
If investment increases by $0.5 trillion, calculate the change in equilibrium expenditure and the multiplier.In an economy with no exports and no imports, autonomous consumption is $1 trillion, the marginal propensity to consume is 0.8, investment is $5 trillion, and government expenditure on goods
If real GDP is $30 trillion, explain the process that takes the economy to equilibrium expenditure. If real GDP is $40 trillion, explain the process that takes the economy to equilibrium expenditure.In an economy with no exports and no imports, autonomous consumption is $1 trillion, the marginal
If real GDP is $30 trillion, calculate disposable income, consumption expenditure, and aggregate planned expenditure. What is equilibrium expenditure?In an economy with no exports and no imports, autonomous consumption is $1 trillion, the marginal propensity to consume is 0.8, investment is $5
What determines the increase in aggregate demand resulting from an increase in durable goods orders?U.S. durable goods orders rebound strongly, the Commerce Department reported that orders for durable goods increased 4.9 percent in January. Civilian aircraft orders surged 54.2 percent.
Explain the process by which an increase in durable goods orders at a constant price level changes equilibrium expenditure and real GDP.U.S. durable goods orders rebound strongly, the Commerce Department reported that orders for durable goods increased 4.9 percent in January. Civilian aircraft
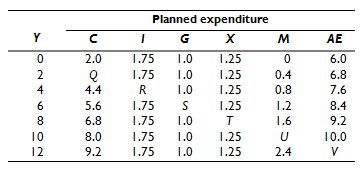
If investment crashes to $0.55 million but nothing else changes, what is equilibrium expenditure and what is the multiplier?The table shows real GDP, Y, the components of planned expenditure, and aggregate planned expenditure (in millions of dollars) in an economy in which taxes are constant.
Calculate the marginal propensity to consume and the marginal propensity to import. What is equilibrium expenditure?The table shows real GDP, Y, the components of planned expenditure, and aggregate planned expenditure (in millions of dollars) in an economy in which taxes are constant. Planned
Find the value of Q, R, S, T, U, and V.The table shows real GDP, Y, the components of planned expenditure, and aggregate planned expenditure (in millions of dollars) in an economy in which taxes are constant. Planned expenditure AE 2.0 1.75 1.0 1.25 6.0 1.75 1.0 1.25 0.4 6.8 4.4 1.0 1.25 0.8 7.6
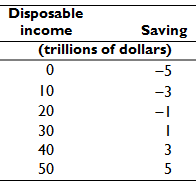
Calculate consumption expenditure at each level of disposable income. Over what range of disposable income is there dissaving? Estimate the level of disposable income at which saving is zero.The table shows disposable income and saving in an economy. Use the table to answer Problem. Disposable
Calculate the marginal propensity to consume. If wealth increases by $10 trillion, in which direction will the consumption function change?The table shows disposable income and saving in an economy. Use the table to answer Problem. Disposable income Saving (trillions of dollars) -5 10 -3 20 -I 30
The U.K. economy in 2016 was close to full employment. Use the AS-AD model to show the effect on U.K. real GDP of the effects of Brexit described in the news clip.Brexit means a bumpy road ahead for the U.K. economy. The decision by the U.K. people to leave the European Union has already brought a
Explain the effects of a fall in the value of the U.K. pound and lower spending by businesses and households on U.K. aggregate demand and aggregate supply.Brexit means a bumpy road ahead for the U.K. economy. The decision by the U.K. people to leave the European Union has already brought a
When Martin Feldstein describes the Fed’s monetary policy as “easy,” he means that the Fed has created a lot of money, has made money grow at a fast rate, and has pushed interest rates down. Looking at the graph in Eye on Inflation (p. 316), has money been “easy” during the 2010s? In
Why might Martin Feldstein be right? If he is right, what is he implying about the equation of exchange and the quantity theory of money?Robert F. Stauffer, Emeritus Professor of Economics at Roanoke College, Salem, Virginia, argues that the Fed’s monetary policy cannot closely control the price
Why might Robert Stauffer be right? If he is right, what is he implying about the equation of exchange and the quantity theory of money?Robert F. Stauffer, Emeritus Professor of Economics at Roanoke College, Salem, Virginia, argues that the Fed’s monetary policy cannot closely control the price
Read Eye on Creating Money on pp. 292—293. By how much did the monetary base increase and why didn’t M2 increase by the same percentage?
When the Fed increased the monetary base between 2008 and 2014, which component of the monetary base increased most: banks’ reserves or currency? What happened to the reserves that banks borrowed from the Fed?
What happened to the money multiplier between 2008 and 2014? What would the money multiplier have been if the currency drain ratio had increased? What would the money multiplier have been if the banks’ desired reserve ratio had not changed?
What are the three functions that money performs? Which of the following items perform some but not all of these functions and which of the items are money?An antique clockAn S&L savings depositYour credit cardThe coins in the Fed’s museumGovernment securities
What is the quantity theory of money? Define the velocity of circulation and explain how it is measured.
Naomi buys $1,000 worth of American Express travelers’ checks and charges the purchase to her American Express card. What is the immediate change in M1 and M2?
Showing 4600 - 4700
of 5010
First
37
38
39
40
41
42
43
44
45
46
47
48
49
50
51
Step by Step Answers