New Semester
Started
Get
50% OFF
Study Help!
--h --m --s
Claim Now
Question Answers
Textbooks
Find textbooks, questions and answers
Oops, something went wrong!
Change your search query and then try again
S
Books
FREE
Study Help
Expert Questions
Accounting
General Management
Mathematics
Finance
Organizational Behaviour
Law
Physics
Operating System
Management Leadership
Sociology
Programming
Marketing
Database
Computer Network
Economics
Textbooks Solutions
Accounting
Managerial Accounting
Management Leadership
Cost Accounting
Statistics
Business Law
Corporate Finance
Finance
Economics
Auditing
Tutors
Online Tutors
Find a Tutor
Hire a Tutor
Become a Tutor
AI Tutor
AI Study Planner
NEW
Sell Books
Search
Search
Sign In
Register
study help
business
intro stats
Stats Data And Models (Subscription) 3rd Edition Richard D De Veaux, Paul D Velleman, David E Bock - Solutions
Normal cattle. Using N(1152, 84), the Normal model for weights of Angus steers in Exercise 17, what percent of steers weigha) over 1250 pounds?b) under 1200 pounds?c) between 1000 and 1100 pounds?
Customer database. Alarge philanthropic organization keeps records on the people who have contributed to their cause. In addition to keeping records of past giving, the organization buys demographic data on neighborhoods from the U.S. Census Bureau. Eighteen of these variables concern the ethnicity
Receivers. NFL data from the 2006 football season reported the number of yards gained by each of the league’s 167 wide receivers:The mean is 435 yards, with a standard deviation of 384 yards.a) According to the Normal model, what percent of receivers would you expect to gain fewer yards than 2
Check the model. The mean of the 100 car speeds in Exercise 20 was 23.84 mph, with a standard deviation of 3.56 mph.a) Using a Normal model, what values should border the middle 95% of all car speeds?b) Here are some summary statistics.From your answer in parta, how well does the model do in
Winter Olympics 2006 downhill. Fifty-three men qualified for the men’s alpine downhill race in Torino. The gold medal winner finished in 1 minute, 48.8 seconds.All competitors’ times (in seconds) are found in the following list:a) The mean time was 113.02 seconds, with a standard deviation of
Car speeds, the picture. For the car speed data of Exercise 18, here is the histogram, boxplot, and Normal probability plot of the 100 readings. Do you think it is appropriate to apply a Normal model here? Explain. 20 15 10 5- # of cars 15.0 22.5 30.0 Speed (mph) 32 28 2222 24 20 Speed (mph) -1.25
Trees, part II. Later on, the forester in Exercise 29 shows you a histogram of the tree diameters he used in analyzing the woods that was for sale. Do you think he was justified in using a Normal model? Explain, citing some specific concerns. 4 # of Trees 3 2 1 0.0 4.5 9.0 Diameter (in.) 13.5 18.0
Rivets. A company that manufactures rivets believes the shear strength (in pounds) is modeled by N(800, 50).a) Draw and label the Normal model.b) Would it be safe to use these rivets in a situation requiring a shear strength of 750 pounds? Explain.c) About what percent of these rivets would you
Trees. A forester measured 27 of the trees in a large woods that is up for sale. He found a mean diameter of 10.4 inches and a standard deviation of 4.7 inches. Suppose that these trees provide an accurate description of the whole forest and that a Normal model applies.a) Draw the Normal model for
High IQ. Exercise 26 proposes modeling IQ scores with N(100, 16). What IQ would you consider to be unusually high? Explain.
Small steer. In Exercise 17 we suggested the model N(1152, 84) for weights in pounds of yearling Angus steers. What weight would you consider to be unusually low for such an animal? Explain.
IQ. Some IQ tests are standardized to a Normal model, with a mean of 100 and a standard deviation of 16.a) Draw the model for these IQ scores. Clearly label it, showing what the 68–95–99.7 Rule predicts.b) In what interval would you expect the central 95% of IQ scores to be found?c) About what
Guzzlers? Environmental Protection Agency (EPA) fuel economy estimates for automobile models tested recently predicted a mean of 24.8 mpg and a standard 100 + 10152 = $150 0.40 111002 - 20 = $420.deviation of 6.2 mpg for highway driving. Assume that a Normal model can be applied.a) Draw the model
Rock concerts. A popular band on tour played a series of concerts in large venues. They always drew a large crowd, averaging 21,359 fans. While the band did not announce (and probably never calculated) the standard deviation, which of these values do you think is most likely to be correct: 20, 200,
Professors. A friend tells you about a recent study dealing with the number of years of teaching experience among current college professors. He remembers the mean but can’t recall whether the standard deviation was 6 months, 6 years, or 16 years. Tell him which one it must have been, and why.
They handed out a large number of tickets to speeders going a mean of 28 mph, with a standard deviation of 2.4 mph, a maximum of 33 mph, and an IQR of 3.2 mph. Local law prescribes fines of $100, plus$10 per mile per hour over the 20 mph speed limit. For example, a driver convicted of going 25 mph
Caught speeding. Suppose police set up radar surveillance on the Stanford street described in Exercise
Cattle, part III. Suppose the auctioneer in Exercise 19 sold a herd of cattle whose minimum weight was 980 pounds, median was 1140 pounds, standard deviation 84 pounds, and IQR 102 pounds. They sold for 40 cents a pound, and the auctioneer took a $20 commission on each animal. Then, for example, a
Car speeds again. For the car speed data of Exercise 18, recall that the mean speed recorded was 23.84 mph, with a standard deviation of 3.56 mph. To see how many cars are speeding, John subtracts 20 mph from all speeds.a) What is the mean speed now? What is the new standard deviation?b) His friend
More cattle. Recall that the beef cattle described in Exercise 17 had a mean weight of 1152 pounds, with a standard deviation of 84 pounds.a) Cattle buyers hope that yearling Angus steers will weigh at least 1000 pounds. To see how much over (or under) that goal the cattle are, we could subtract
Car speeds. John Beale of Stanford, CA, recorded the speeds of cars driving past his house, where the speed limit read 20 mph. The mean of 100 readings was 23.84 mph, with a standard deviation of 3.56 mph.(He actually recorded every car for a two-month period.These are 100 representative
Cattle. The Virginia Cooperative Extension reports that the mean weight of yearling Angus steers is 1152 pounds. Suppose that weights of all such animals can be described by a Normal model with a standard deviation of 84 pounds.a) How many standard deviations from the mean would a steer weighing
MP3s. Two companies market new batteries targeted at owners of personal music players. DuraTunes claims a mean battery life of 11 hours, while RockReady advertises 12 hours.a) Explain why you would also like to know the standard deviations of the battery lifespans before deciding which brand to
Final exams. Anna, a language major, took final exams in both French and Spanish and scored 83 on each. Her roommate Megan, also taking both courses, scored 77 on the French exam and 95 on the Spanish exam. Overall, student scores on the French exam had a mean of 81 and a standard deviation of 5,
Combining scores again. The first Stat exam had a mean of 80 and a standard deviation of 4 points; the second had a mean of 70 and a standard deviation of 15 points. Reginald scored an 80 on the first test and an 85 on the second. Sara scored an 88 on the first but only a 65 on the second. Although
Combining test scores. The first Stats exam had a mean of 65 and a standard deviation of 10 points; the second 55°8°74°36°F 10°-2-1.88.Median = 2° IQR = 16°Mean = 1° Standard deviation = 7°Maximum temperature = 11°C Range = 33°°F = 9>5°C + 32.Q3 = 30 Median = 28 IQR = 6= 19 Mean = 27 =
On which exam did she do better compared with the other freshmen?
The overall results on the French exam had a mean of 72 and a standard deviation of 8, while the mean math score was 68, with a standard deviation of
Placement exams. An incoming freshman took her college’s placement exams in French and mathematics.In French, she scored 82 and in math
Temperatures. A town’s January high temperatures average with a standard deviation of , while in July the mean high temperature is and the standard deviation is . In which month is it more unusual to have a day with a high temperature of ? Explain.
Mensa. People with z-scores above 2.5 on an IQ test are sometimes classified as geniuses. If IQ scores have a mean of 100 and a standard deviation of 16 points, what IQ score do you need to be considered a genius?
Stats test, part II. The mean score on the Stats exam was 75 points with a standard deviation of 5 points, and Gregor’s z-score was . How many points did he score?
Checkup. One of the authors has an adopted grandson whose birth family members are very short. After examining him at his 2-year checkup, the boy’s pediatrician said that the z-score for his height relative to American 2-year-olds was Write a sentence explaining what that means.
Stats test. Suppose your Statistics professor reports test grades as z-scores, and you got a score of 2.20 on an exam. Write a sentence explaining what that means.
Cold U? A high school senior uses the Internet to get information on February temperatures in the town where he’ll be going to college. He finds a website with some statistics, but they are given in degrees Celsius.The conversion formula is Determine the Fahrenheit equivalents for the summary
Since the two exams use very different scales, comparisons of performance are difficult. A convenient rule of thumb is that is, multiply an ACT score by 40 and add 150 points to estimate the equivalent SAT score. An admissions officer reported the following statistics about the ACT scores of 2355
SAT or ACT? Each year thousands of high school students take either the SAT or the ACT, standardized tests used in the college admissions process. Combined SAT Math and Verbal scores go as high as 1600, while the maximum ACT composite score is
Hams. A specialty foods company sells “gourmet hams”by mail order. The hams vary in size from 4.15 to 7.45 pounds, with a mean weight of 6 pounds and standard deviation of 0.65 pounds. The quartiles and median weights are 5.6, 6.2, and 6.55 pounds.a) Find the range and the IQR of the weights.b)
Payroll. Here are the summary statistics for the weekly payroll of a small company: lowest , mean first standard deviation = $400.IQR = $600, quartile = $350, salary = $700,median = $500, range = $1200, salary = $300= 16 EXERCISESa) Do you think the distribution of salaries is symmetric, skewed to
Hotline. A company’s customer service hotline handles many calls relating to orders, refunds, and other issues.The company’s records indicate that the median length of calls to the hotline is 4.4 minutes with an IQR of 2.3 minutes.a) If the company were to describe the duration of these calls
Shipments. A company selling clothing on the Internet reports that the packages it ships have a median weight of 68 ounces and an IQR of 40 ounces.a) The company plans to include a sales flyer weighing 4 ounces in each package. What will the new median and IQR be?b) If the company recorded the
Stereograms, revisited. Because of the skewness of the distributions of fusion times described in Exercise 41, we might consider a re-expression. Here are the boxplots of the log of fusion times. Is it better to analyze the original fusion times or the log fusion times? Explain. Log Fusion Time 00
Stereograms. Stereograms appear to be composed entirely of random dots. However, they contain separate images that a viewer can “fuse” into a three-dimensional(3D) image by staring at the dots while defocusing the eyes. An experiment was performed to determine whether knowledge of the embedded
Rainmakers. The table lists the amount of rainfall (in acre-feet) from the 26 clouds seeded with silver iodide discussed in Exercise 30:a) Why is acre-feet a good way to measure the amount of precipitation produced by cloud seeding?b) Plot these data, and describe the distribution.c) Create a
Assets again. Here are the same data you saw in Exercise 37 after re-expressions as the square root of assets and the logarithm of assets:a) Which re-expression do you prefer? Why?b) In the square root re-expression, what does the value 50 actually indicate about the company’s assets?c) In the
Music library. Students were asked how many songs they had in their digital music libraries. Here’s a display of the responses:a) What aspect of this distribution makes it difficult to summarize, or to discuss, center and spread?b) What would you suggest doing with these data if we want to
Assets. Here is a histogram of the assets (in millions of dollars) of 79 companies chosen from the Forbes list of the nation’s top corporations:a) What aspect of this distribution makes it difficult to summarize, or to discuss, center and spread?b) What would you suggest doing with these data if
Drunk driving 2007. Accidents involving drunk drivers account for about 40% of all deaths on the nation’s highways.The table tracks the number of alcohol-related fatalities for 26 years. (www.alcoholalert.com)a) Create a stem-and-leaf display or a histogram of these data.b) Create a timeplot.c)
Fruit flies. Researchers tracked a population of 1,203,646 fruit flies, counting how many died each day for 171 days. Here are three timeplots offering different views of these data. One shows the number of flies alive on each day, one the number who died that day, and the third the mortality
Baseball 2008. American League baseball teams play their games with the designated hitter rule, meaning that pitchers do not bat. The League believes that replacing the pitcher, typically a weak hitter, with another player in the batting order produces more runs and generates more interest among
MPG. A consumer organization compared gas mileage figures for several models of cars made in the United States with autos manufactured in other countries. The data are shown in the table.a) Create graphical displays for these two groups.b) Write a few sentences comparing the distributions. Gas
Cholesterol. A study examining the health risks of smoking measured the cholesterol levels of people who had smoked for at least 25 years and people of similar ages who had smoked for no more than 5 years and then stopped. Create appropriate graphical displays for both groups, and write a brief
Industrial experiment. Engineers at a computer production plant tested two methods for accuracy in drilling holes into a PC board. They tested how fast they could set the drilling machine by running 10 boards at each of two different speeds. To assess the results, they measured the distance (in
Cloud seeding. In an experiment to determine whether seeding clouds with silver iodide increases rainfall, 52 clouds were randomly assigned to be seeded or not.The amount of rain they generated was then measured(in acre-feet). Here are the summary statistics:a) Which of the summary statistics are
Reading scores. A class of fourth graders takes a diagnostic reading test, and the scores are reported by reading grade level. The 5-number summaries for the 14 boys and 11 girls are shown:a) Which group had the highest score?b) Which group had the greater range?c) Which group had the greater
Framingham. The Framingham Heart Study recorded the cholesterol levels of more than 1400 men. Here is an ogive of the distribution of these cholesterol measures.(An ogive shows the percentage of cases at or below a certain value.) Construct a boxplot for these data, and write a few sentences
Derby speeds 2007. How fast do horses run? Kentucky Derby winners top 30 miles per hour, as shown in this graph. The graph shows the percentage of Derby winners that have run slower than each given speed.Note that few have won running less than 33 miles per hour, but about 86% of the winning horses
SAT scores. Here are the summary statistics for Verbal SAT scores for a high school graduating class:a) Create side-by-side boxplots comparing the scores of boys and girls as best you can from the information given.b) Write a brief report on these results. Be sure to discuss the shape, center, and
Caffeine. A student study of the effects of caffeine asked volunteers to take a memory test 2 hours after drinking soda. Some drank caffeine-free cola, some drank regular cola (with caffeine), and others drank a mixture of the two (getting a half-dose of caffeine). Here are the 5-number summaries
Vineyards. Here are summary statistics for the sizes(in acres) of Finger Lakes vineyards:a) Would you describe this distribution as symmetric or skewed? Explain.b) Are there any outliers? Explain.c) Create a boxplot of these data.d) Write a few sentences about the sizes of the vineyards. Count 36
Graduation? A survey of major universities asked what percentage of incoming freshmen usually graduate“on time” in 4 years. Use the summary statistics given to answer the questions that follow.a) Would you describe this distribution as symmetric or skewed? Explain.b) Are there any outliers?
Eye and hair color. A survey of 1021 school-age children was conducted by randomly selecting children from several large urban elementary schools. Two of the questions concerned eye and hair color. In the survey, the following codes were used:The Statistics students analyzing the data were asked to
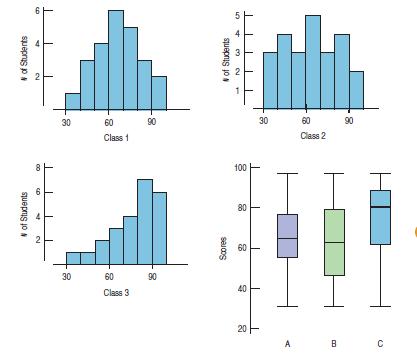
Test scores. Three Statistics classes all took the same test.Histograms and boxplots of the scores for each class are shown below. Match each class with the corresponding boxplot. # of Students 2 00 # of Students 6 2 Class 1 90 30 60 Class 3 90 30 60 4 of Students 3 100 Scores 30 90 60 Class 2 80
Ozone. Ozone levels (in parts per billion, ppb) were recorded at sites in New Jersey monthly between 1926 and 1971. Here are boxplots of the data for each month(over the 46 years), lined up in order (January = 1):a) In what month was the highest ozone level ever recorded?b) Which month has the
Fuel economy II. The Environmental Protection Agency provides fuel economy and pollution information on over 2000 car models. Here is a boxplot of Combined Fuel Economy (using an average of driving conditions) in miles per gallon by vehicle Type (car, van, or SUV). Summarize what you see about the
Fuel economy. Describe what these boxplots tell you about the relationship between the number of cylinders a car’s engine has and the car’s fuel economy (mpg): 35 30 Fuel Efficiency (mpg) 25 20 20 15 HIH 4 5 6 8 Cylinders
Marriage age. In 1975, did men and women marry at the same age? Here are boxplots of the age at first marriage for a sample of U.S. citizens then. Write a brief report discussing what these data show. 28 20 26 24 24 Age at First Marriage 22 20 20 Women Men
Gas prices. Here are boxplots of weekly gas prices at a service station in the midwestern United States (prices in $ per gallon):a) Compare the distribution of prices over the three years.b) In which year were the prices least stable? Explain. 2.00 1.75 Price ($) 1.50 1.25 1.00 HIH *** of 2002
Women’s basketball. Here are boxplots of the points scored during the first 10 games of the season for both Scyrine and Alexandra:a) Summarize the similarities and differences in their performance so far.b) The coach can take only one player to the state championship.Which one should she take?
Deaths 2003. A National Vital Statistics Report(www.cdc.govchs/) indicated that nearly 300,000 black Americans died in 2003, compared with just over 2 million white Americans. Below are histograms displaying the distributions of their ages at death.a) Describe the overall shapes of these
Hospital stays. The U.S. National Center for Health Statistics compiles data on the length of stay by patients in short-term hospitals and publishes its findings in Vital and Health Statistics. Data from a sample of 39 male patients and 35 female patients on length of stay (in days)are displayed in
Camp sites. Shown below are the histogram and summary statistics for the number of camp sites at public parks in Vermont.a) Which statistics would you use to identify the center and spread of this distribution? Why?b) How many parks would you classify as outliers?Explain.c) Create a boxplot for
Population growth. Here is a “back-to-back” stem-andleaf display that shows two data sets at once—one going to the left, one to the right. The display compares the percent change in population for two regions of the United States (based on census figures for 1990 and 2000). The fastest
Tendon transfers. People with spinal cord injuries may lose function in some, but not all, of their muscles. The ability to push oneself up is particularly important for shifting position when seated and for transferring into and out of wheelchairs. Surgeons compared two operations to restore the
Cereals. Sugar is a major ingredient in many breakfast cereals. The histogram displays the sugar content as a percentage of weight for 49 brands of cereal. The boxplot compares sugar content for adult and children’s cereals.a) What is the range of the sugar contents of these cereals?b) Describe
Slalom times. The Men’s Combined skiing event consists of a downhill and a slalom. Two displays of the slalom times in the Men’s Combined at the 2006 Winter Olympics are shown below.a) What features of the distribution can you see in both the histogram and the boxplot?b) What features of the
Rock concert accidents. Crowd Management Strategies monitors accidents at rock concerts. In their database, they list the names and other variables of victims whose deaths were attributed to “crowd crush” at rock concerts.Here are the histogram and boxplot of the victims’ ages for data from
Costs. To help travelers know what to expect, researchers collected the prices of commodities in 16 cities throughout the world. Here are boxplots comparing the prices of a ride on public transportation, a newspaper, and a cup of coffee in the 16 cities (prices are all in $US).a) On average, which
Pizza prices. A company that sells frozen pizza to stores in four markets in the United States (Denver, Baltimore, Dallas, and Chicago) wants to examine the prices that the stores charge for pizza slices. Here are boxplots comparing data from a sample of stores in each market:a) Do prices appear to
Groups on the Internet. Find data on the Internet (or elsewhere)for two or more groups. Make appropriate displays to compare the groups, and interpret what you find.
Time on the Internet. Find data on the Internet (or elsewhere) that give results recorded over time. Make an appropriate display and discuss what it shows.
In the news. Find an article in a newspaper, magazine, or the Internet that shows a time plot.a) Does the article discuss the W’s?b) Is the timeplot appropriate for the data? Explain.c) Discuss what the timeplot reveals about the variable.d) Does the article accurately describe and interpret the
In the news. Find an article in a newspaper, magazine, or the Internet that compares two or more groups of data.a) Does the article discuss the W’s?b) Is the chosen display appropriate? Explain.c) Discuss what the display reveals about the groups.d) Does the article accurately describe and
Prisons 2005. A report from the U.S. Department of Justice (www.ojp.usdoj.gov/bjs/) reported the percent changes in federal prison populations in 21 northeastern and midwestern states during 2005. Using appropriate graphical displays and summary statistics, write a report on the changes in prison
Gasoline usage 2004. The California Energy Commission(www.energy.ca.gov/gasoline/) collects data on the amount of gasoline sold in each state. The following data show the per capita (gallons used per person) consumption in the year 2004. Using appropriate graphical displays and summary statistics,
Boomtowns. In 2006, Inc. magazine (www.inc.com)listed its choice of “boomtowns” in the United States—larger cities that are growing rapidly. Here is the magazine’s top 20, along with their job growth percentages:a) Make a suitable display of the growth rates.b) Summarize the typical growth
Math scores 2005. The National Center for Education Statistics (http:/ces.ed.govationsreportcard/)reported 2005 average mathematics achievement scores for eighth graders in all 50 states:a) Find the median, the IQR, the mean, and the standard deviation of these state averages.b) Which summary
Zip codes revisited. Here are some summary statistics to go with the histogram of the zip codes of 500 customers from the Holes-R-Us Internet Jewelry Salon that we saw in Exercise 47:What can these statistics tell you about the company’s sales? Count 500 Mean 64,970.0 StdDev 23,523.0 Median
Zip codes. Holes-R-Us, an Internet company that sells piercing jewelry, keeps transaction records on its sales. At a recent sales meeting, one of the staff presented a histogram of the zip codes of the last 500 customers, so that the staff might understand where sales are coming from. Comment on
Final grades revisited. After receiving many complaints about his final-grade histogram from students currently taking a Statistics course, the professor from Exercise 45 distributed the following revised histogram:a) Comment on this display.b) Describe the distribution of grades. # of Students
Final grades. A professor (of something other than Statistics!) distributed the following histogram to show the distribution of grades on his 200-point final exam.Comment on the display. # of Students 50 40 30 20 10 50 60 100 150 200 Final Grade
Marijuana 2007. In 2007 the Council of Europe published a report entitled The European School Survey Project on Alcohol and Other Drugs (www.espad.org). Among other issues, the survey investigated the percentages of 16-year-olds who had used marijuana. Shown here are the results for 20 European
Acid rain. Two researchers measured the pH (a scale on which a value of 7 is neutral and values below 7 are acidic) of water collected from rain and snow over a 6-month period in Allegheny County, PA. Describe their data with a graph and a few sentences:4.57 5.62 4.12 5.29 4.64 4.31 4.30 4.39 4.45
One student submitted the following display:a) Comment on this graph.b) Create your own histogram of the data. # of Birds 220 200 180 160 140 120 100 1 2 3 4 5 6 7 8 9 10 11 12 13 14 15 16 17 18 19 20 21 Site Number
Return of the birds. Students were given the assignment to make a histogram of the data on bird counts reported in Exercise
A-Rod again. Students were asked to make a histogram of the number of home runs hit by Alex Rodriguez from 1995 to 2009 (see Exercise 37). One student submitted the following display:a) Comment on this graph.b) Create your own histogram of the data. 60 40 20 20 1995 1999 2003 2007 Year
Horsepower. Create a stem-and-leaf display for these horsepowers of autos reviewed by Consumer Reports one year, and describe the distribution: 155 103 130 80 65 142 125 129 71 69 125 115 138 68 78 150 133 135 90 97 68 105 88 115 110 95 85 109 115 71 97 110 65 90 75 120 80 70
Hurricanes 2006. The data below give the number of hurricanes classified as major hurricanes in the Atlantic Ocean each year from 1944 through 2006, as reported by NOAA(www.nhc.noaa.gov):3, 2, 1, 2, 4, 3, 7, 2, 3, 3, 2, 5, 2, 2, 4, 2, 2, 6, 0, 2, 5, 1, 3, 1, 0, 3, 2, 1, 0, 1, 2, 3, 2, 1, 2, 2, 2,
A-Rod 2009. Alex Rodriguez (known to fans as A-Rod)was the youngest player ever to hit 500 home runs. Here is a stem-and-leaf display of the number of home runs hit by A-Rod during the 1994–2009 seasons. Describe the distribution, mentioning its shape and any unusual features.
Bird species. The Cornell Lab of Ornithology holds an annual Christmas Bird Count (www.birdsource.org), in which bird watchers at various locations around the country see how many different species of birds they can spot. Here are some of the counts reported from sites in Texas during the 1999
Showing 5400 - 5500
of 5937
First
46
47
48
49
50
51
52
53
54
55
56
57
58
59
60
Step by Step Answers