New Semester
Started
Get
50% OFF
Study Help!
--h --m --s
Claim Now
Question Answers
Textbooks
Find textbooks, questions and answers
Oops, something went wrong!
Change your search query and then try again
S
Books
FREE
Study Help
Expert Questions
Accounting
General Management
Mathematics
Finance
Organizational Behaviour
Law
Physics
Operating System
Management Leadership
Sociology
Programming
Marketing
Database
Computer Network
Economics
Textbooks Solutions
Accounting
Managerial Accounting
Management Leadership
Cost Accounting
Statistics
Business Law
Corporate Finance
Finance
Economics
Auditing
Tutors
Online Tutors
Find a Tutor
Hire a Tutor
Become a Tutor
AI Tutor
AI Study Planner
NEW
Sell Books
Search
Search
Sign In
Register
study help
business
intro stats
Intro Stats 5th Edition Richard D De Veaux, Paul F Velleman, David E Bock, Nick Horton - Solutions
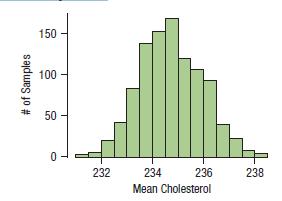
In Chapter 4, Exercise 38, we saw an ogive of the distribution of cholesterol levels (in mg/dL) of a random sample of 1406 participants (taken in 1948 from Framingham, MA). To find a bootstrap confidence interval for the mean cholesterol, a student took 1000 bootstrap samples, calculated the mean
A Consumer Reports study similar to the one described in Exercise 31 found that 12 of the 22 “red snapper” packages tested were a different kind of fish.a) Are the conditions for creating a confidence interval satisfied?b) Construct a 95% confidence interval.c) Explain what your confidence
The Pew Research poll described in Exercise 5 found that 56% of a sample of 1060 teens go online several times a day. (Treat this as a simple random sample.)a) Find the margin of error for this poll if we want 95% confidence in our estimate of the percent of American teens who go online several
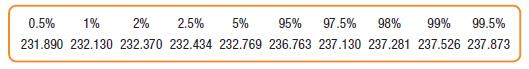
Chapter 2, Exercise 16 showed the histogram of the European shoe sizes from a sample of 269 college students. Looking at the men only, a 95% confidence interval for the mean shoe size shows: 95 percent confidence interval: 44.3071............................44.9900 The student knows
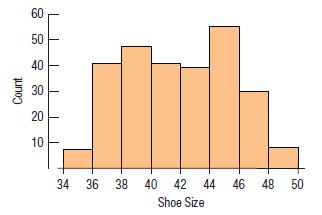
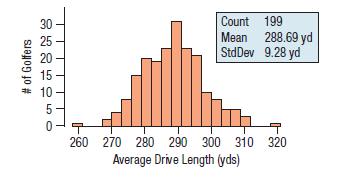
The Professional Golfers Association reported the average distance that 199 professional golfers drove the ball (in yd) during a week in 2015. Here is a histogram of those drives. Assume this is a representative sample of all professional golfers.a) Find a 95% confidence interval for the mean of
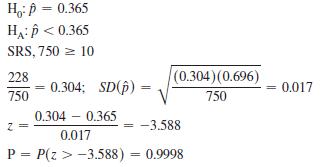
In 2016, the Centers for Disease Control and Prevention reported that 36.5% of adults in the United States are obese. A county health service planning a new awareness campaign polls a random sample of 750 adults living there. In this sample, 228 people were found to be obese based on their answers
For the confidence interval you found in Exercise 11, interpret this interval and explain what 95% confidence means in this context.Data From Exercise 11The housing market recovered slowly from the economic crisis of 2008. Recently, in one large community, realtors randomly sampled 36
In the latest National Health and Nutrition Examination Survey (NHANES 2013/2014 – wwwn.cdc.gov/nchs/nhanes), pulse rate (30 sec rate multiplied by 2) of 2536 U.S. adults averaged 71.6 beats/min with a standard deviation of 11.5 beats/min. (Data in NHANES)a) Can you apply the Central Limit
Referring to the study of Exercise 1:a) Is the alternative to the null hypothesis more naturally one sided or two-sided?b) The P-value from a clinical trial testing the hypothesis is 0.0028. What do you conclude?c) What would you have concluded if the P-value had been 0.28?Data From Exercise 1A
After the political ad campaign described in Exercise 15, part a, pollsters check the governor’s negatives. They test the hypothesis that the ads produced no change against the alternative that the negatives are now below 30% and find a P-value of 0.22. Which conclusion is appropriate? Explain.a)
During the first 15 weeks of the 2016 season, the home team won 137 of the 238 regular-season National Football League games. Is this strong evidence of a home field advantage in professional football? Test an appropriate hypothesis and state your conclusion. Be sure the appropriate assumptions and
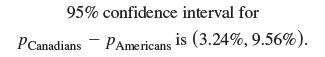
For the interval given in Exercise 3, explain what “95% confidence” means.Data From Exercise 3The information in Exercise 1 was used to create a 95% two-proportion confidence interval for the difference between Canadians and U.S. citizens who were born in foreign countries.
A study of the effects of acid rain on trees in the Hopkins Forest shows that 25 of 100 trees sampled exhibited some sort of damage from acid rain. This rate seemed to be higher than the 15% quoted in a recent Environmetrics article on the average proportion of damaged trees in the Northeast. Does
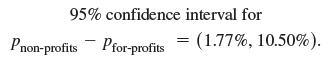
For the interval given in Exercise 4, explain what “95% confidence” means.Data From Exercise 4The researchers from Exercise 2 created a 95% two-proportion confidence interval for the difference in those who are “highly satisfied” when comparing people who work at
The researchers from Exercise 1 want to test if the proportions of foreign born are the same in the United States and Canada. What is the appropriate standard error to use for the hypothesis test?a) What is the difference in the proportions of foreign born residents in both countries?b) What is the
How large are hamster litters? Among 47 golden hamster litters recorded, there were an average of 7.72 baby hamsters, with a standard deviation of 2.5 hamsters per litter.a) Create and interpret a 90% confidence interval.b) Would a 98% confidence interval have a larger or smaller margin of error?c)
Complete the analysis begun in Exercise 2.a) What is the difference in the proportions of the two types of companies?b) What is the value of the z-statistic?c) What do you conclude at α = 0.05?Data From Exercise 2Do people who work for non-profit organizations differ from those who work at
A group of 5 women became pregnant while undergoing fertility treatments with the drug Clomid, discussed in Exercise 4. What’s the probability thata) None will have twins?b) Exactly 1 will have twins?c) At least 3 will have twins?Data From Exercise 4In the United States, the probability of having
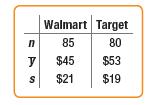
Using the summary statistics provided in Exercise 11, researchers calculated a 95% confidence interval for the mean difference between Walmart and Target purchase amounts. The interval was (–14.15, – $1.85).Data From Exercise 11Do consumers spend more on a trip to Walmart or Target? Suppose
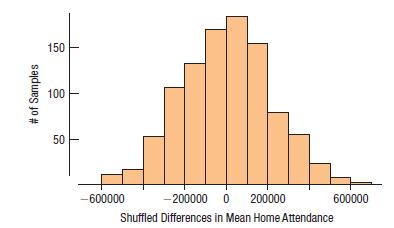
We have seen data on ballpark attendance in Chapters 6, 7, and 9. Now we find that National League teams drew in, on average, nearly 60,000 more fans per season than American League teams. That translates to over $1,000,000 a year. To see whether that difference is statistically significant:a) Make
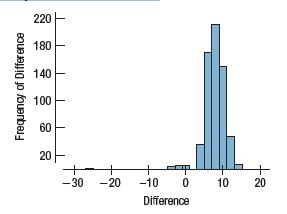
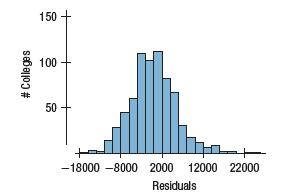
In Exercise 72, we saw that the towns in the region south of Derby seemed to have fewer deaths than the towns in the north. To see whether that difference is statistically significant, look at this histogram of 1000 differences in mean Mortality by Region. What does it say about whether a
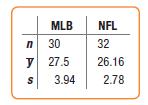
Using the summary statistics provided in Exercise 12, the sports reporter calculated the following 95% confidence interval for the mean difference between major league baseball players and professional football players. The 95% interval for μMLB – μNFL was (–0.41, 3.09). Summarize in context
We have data on the city and highway fuel efficiency of 633 cars and trucks.a) Would it be appropriate to use paired t methods to compare the city fuel efficiency of the cars and the trucks?b) Would it be appropriate to use paired t methods to compare the city and highway fuel efficiencies of these
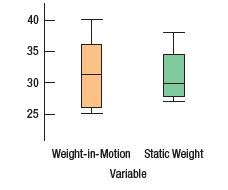
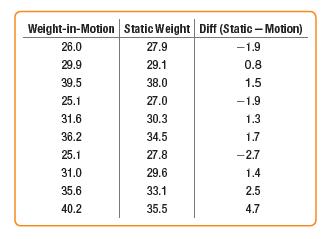
Consider the weights from Exercise 4. The side-by-side boxplots below show little difference between the two groups. Should this be sufficient to draw a conclusion about the accuracy of the weigh-in-motion scale?Data From Exercise 4The calibration test for a new weight-inmotion method of
In a survey of 1002 U.S. adults in December 2016 by Pew Research (www.journalism.org/2016/12/15/many-americans-believe-fake-news-is- owing-confusion/), 64% of adult respondents say they think that made-up “news” is causing a great deal of confusion about the basic facts of current issues and
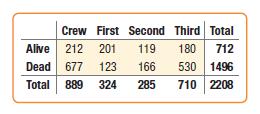
Examine and comment on this table of the standardized residuals for the chi-square test you looked at in Exercise 33.Data From Exercise 33Here is a table we first saw in Chapter 2 showing who survived the sinking of the Titanic based on whether they were crew members, or passengers
In March 2016, Pew Research asked a random sample of 2254 U.S. adults, “Do you strongly favor, favor, oppose, or strongly oppose allowing gays and lesbians to marry legally?” (www.people-press.org/2016/03/31/campaign-exposes-fissures-over-issues-values-and-howlife-has-changed-in-the-u-s/). Of
Data collected in 2015 by the Behavioral Risk Factor Surveillance System revealed that in the state of New Jersey, 27.3% of whites and 47.2% of blacks were cigarette smokers. Suppose these proportions were based on samples of 3607 whites and 485 blacks.a) Create a 90% confidence interval for the
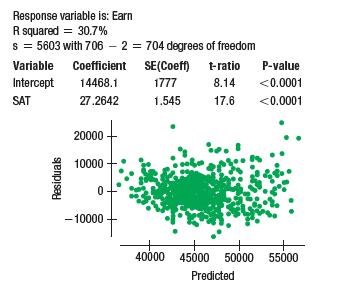
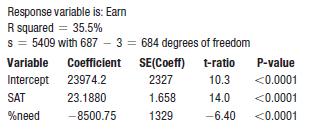
Data From Exercise 1Does attending college pay back the investment? What factors predict higher earnings for graduates? Money magazine surveyed graduates, asking about their point of view of the colleges they had attended (Money’s Best Colleges at
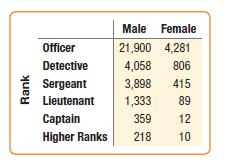
Examine and comment on this table of the standardized residuals for the chi-square test you looked at in Exercise 34.Data From Exercise 34The table below shows the rank attained by male and female officers in the New York City Police Department (NYPD). Do these data indicate that men
For the data in Exercise 2,a) Compute the standardized residual for each type of card.b) Are any of these particularly large? (Compared to what?)c) What does the answer to part b say about this new group of customers?Data From Exercise 2At a major credit card bank, the percentages of people
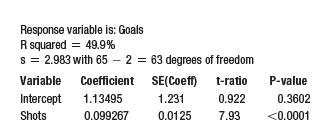
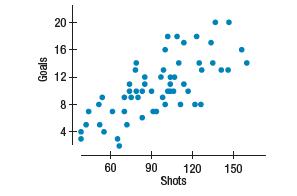
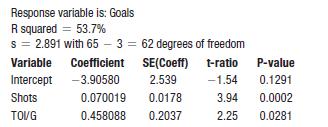
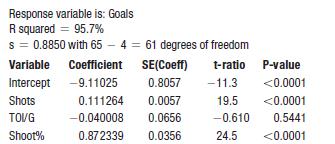
A college hockey coach collected data from the 2016–2017 National Hockey League season. He hopes to convince his players that the number of shots taken has an effect on the number of goals scored. The coach performed a preliminary analysis, using the scoring statistics from 65 offensive players
In Exercises 24, 26, 28, and 30, we considered data on articles in the NEJM. The original study listed 23 different statistics methods. (The list read: t-tests, contingency tables, linear regression, . . . .) Why would it not be appropriate to use a chi-square test on the 23 x 3 table with a row
Discuss the assumptions and conditions necessary for proceeding with the regression analysis in Exercise 2. Do you think the conditions are satisfied?Data From Exercise 2A college hockey coach collected data from the 2016–2017 National Hockey League season. He hopes to convince his players that
Discuss the assumptions and conditions necessary for proceeding with the regression analysis in Exercise 1. Do you think the conditions are satisfied?Data From Exercise 1Does attending college pay back the investment? What factors predict higher earnings for graduates? Money magazine surveyed
Using the regression output in Exercise 1, identify the residual standard deviation and explain what it means in the context of the problem.Data From Exercise 1Does attending college pay back the investment? What factors predict higher earnings for graduates? Money magazine surveyed graduates,
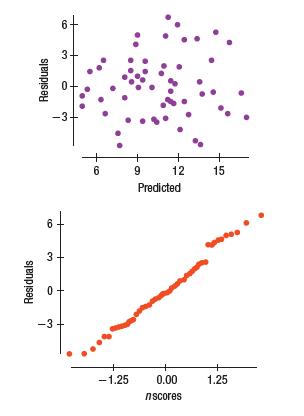
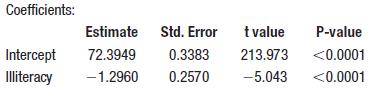
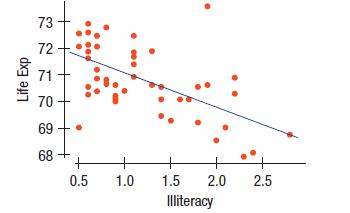
Consider the relationship between the life expectancy (in years) and the illiteracy rate (per hundred people) in the 50 U.S. states plus Washington, DC. A linear model is run and the output is presented here:Residual standard deviation: 1.097 on 48 degrees of freedom Multiple R-squared: 0.3463,a)
Use the information in Exercise 1 to test the hypotheses H0: β1 = 0 vs. HA: β1 ≠ 0. What do you conclude about the relationship between earnings and SAT scores?Data From Exercise 1Does attending college pay back the investment? What factors predict higher earnings for graduates? Money
Since 2000, Cornell University has used lake source cooling plant that circulates water from Cayuga Lake through a heat transfer system to chill water for use on campus in refrigeration and air conditioning. Supporters of this method cite reduced carbon emissions and energy costs.
Continuing with the regression of Exercise 1, write a sentence that explains the meaning of the standard error of the slope of the regression line, SE(b1) = 1.545, and the corresponding P-value.Data From Exercise 1Does attending college pay back the investment? What factors predict higher earnings
A Harvard psychologist recruited 75 female hotel maids to participate in a study. She randomly selected 41 and informed them (truthfully) that the work they do satisfies the Surgeon General’s recommendations for an active lifestyle, providing examples to show them that their work is good
Construct a 95% confidence interval for the slope of the regression line in Exercise 1. Interpret the meaning of the interval. Be sure to state it in the context of the data and the question about the data.Data From Exercise 1Does attending college pay back the investment? What factors predict
A Harvard psychologist recruited 75 female hotel maids to participate in a study. She randomly selected 41 and informed them (truthfully) that the work they do satisfies the Surgeon General’s recommendations for an active lifestyle, providing examples to show them that their work is good
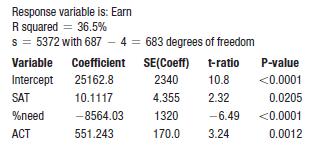
Continuing with the data from Exercise 1, here’s a regression with the percent of students who receive merit-based financial aid included in the model:a) Write the regression model.b) What is the interpretation of the coefficient of SAT in this model? How does it differ from the interpretation in
A second predictor in Exercise 13 improved the regression model of Exercise 1, so let’s try a third. Here’s a model with average ACT score of the entering class included:a) The coefficient of SAT in this model is quite different from the SAT coefficient in the original model of Exercise 1 or
The coach in Exercise 2 found a 95% confidence interval for the slope of his regression line. Recall that he is trying to understand how the number of goals scored is related to shots taken. Interpret with a sentence the meaning of the interval 0.099267 ± 2 x 0.0125Data From Exercise 2A college
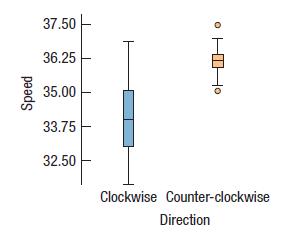
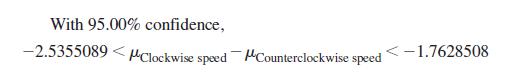
The Belmont Stakes is the last and longest of the three horse races that make up the Triple Crown. Curiously, some of the Belmont races have been run clockwise around the track, and others have been run counterclockwise. Do the horses care? Here are boxplots and a confidence interval for the
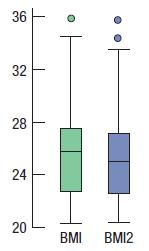
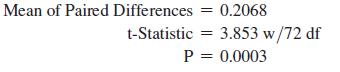
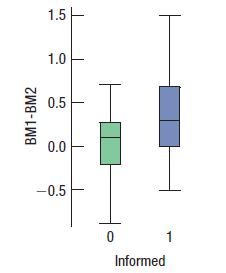
But maybe the BMIs of all the participants changed during the four-week period. We can calculate the change in BMI for each participant in the study, and then compare the mean change for the 41 maids in the informed group with the mean change for the 34 in the uninformed group. Here is a display
Which type of study is this?a) A prospective observational study because it followed the maids for four weeks.b) A retrospective observational study because at the end of four weeks, the researcher had to look back at the original measurements.c) A survey because the maids were randomly selected.
The players on the team in Exercise 2 point out to the coach that they can’t shoot if they are not on the ice. They add the variable Time OnIce/Game (TOI/G) (in minutes per game) to the regression:a) Write the regression model.b) What is the interpretation of the coefficient of Shots in this
The Paralyzed Veterans of America (PVA) is a Congressionally chartered veterans’ service organization that represents the interests of paralyzed veterans. The agency provides a range of services to veterans who have spinal cord injury or dysfunction. It derives most of its funding from
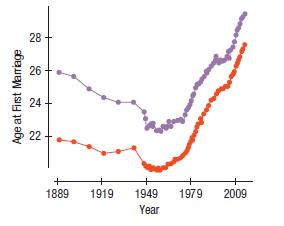
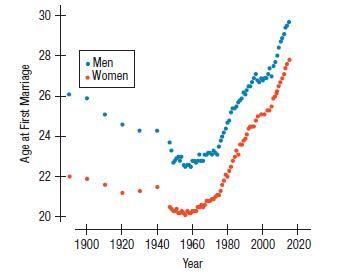
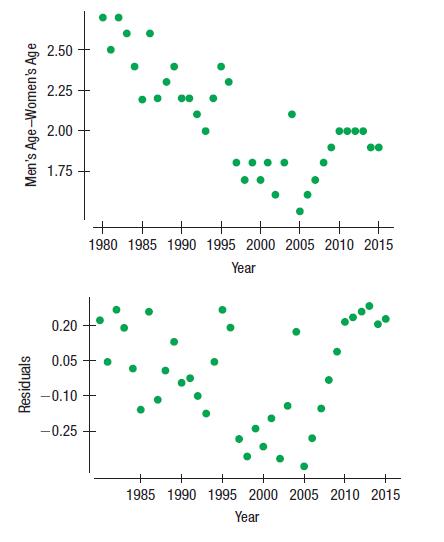
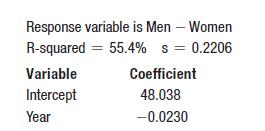
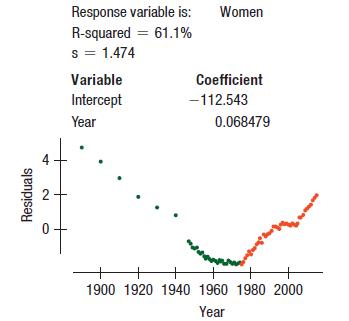
Chapter 8, Exercises 42, 44, and 49, looked at the how the age at first marriage has changed over time for men and women. One trend was that people have been waiting until they are older to get married.Generally, men are older at their first marriage than are women, but the gap seems to have been
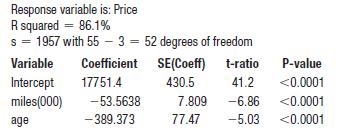
The price of a car depends on its age as well as on its mileage. Here is a regression in which the age of the cars (in years) is included in the regression model from Exercise 34:a) What is the interpretation of the coefficient of miles(000) in this regression? Why is it so different from the
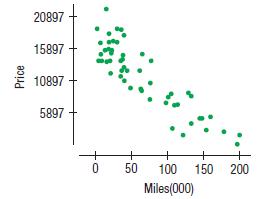
On January 22, 2017, www.autotrader.com listed 55 used Honda Civics for sale by owner. Here’s a scatterplot of the asking price vs. the number of miles on the odometer (in thousands):a) Do you think a linear model is appropriate?Here is the regression model:b) State the null and alternative
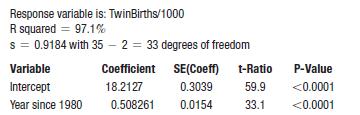
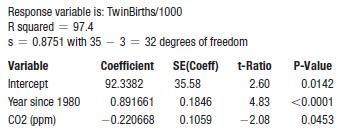
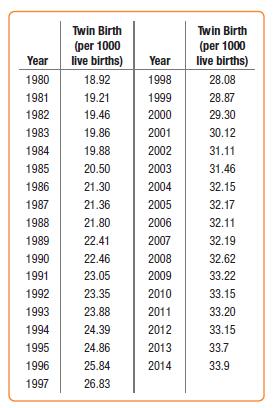
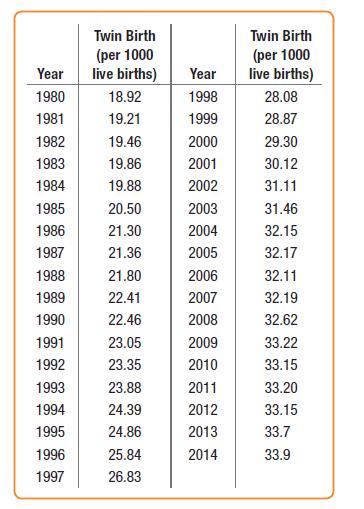
Are twin births becomming more common? Part II Review Exercise R2.5 looked at the number of twin births by year from 1980 to 2014. Now we can include some inference:a) State and test the standard null hypothesis for the slope. An Internet blogger claims that the increase in twin births can be
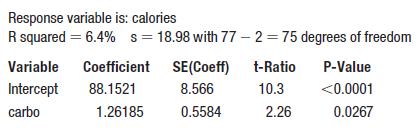
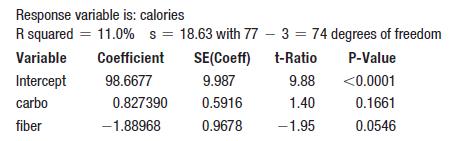
A regression of the calories in breakfast cereals on their carbohydrate content (g) looks like this:A second regression with fiber content included gives this model: A second regression with fiber content included gives this model:a) Give an interpretation of the coefficient of carbo in both
Exercise R5.41 looked at regressions to model calories in breakfast cereals based on their carbohydrates and fiber content. Here is a scatterplot of carbohydrates vs. fiber content for these cereals:The cereals plotted with green x’s are the three bran cereals in the data. How does this plot help
The study described in Exercise R5.21 also looked at scores in mathematics and language. Here are software outputs for the appropriate tests. Data From Exercise R5.21Several programs attempt to address the shortage of qualified teachers by placing uncertified instructors in schools with
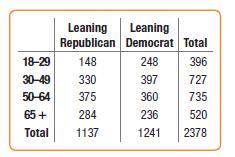
The Pew Research Center conducted a representative telephone survey in October of 2016. Among the reported results was the following table concerning the preferred political party affiliation of respondents and their ages for white voters. Is there evidence of age-based differences in party
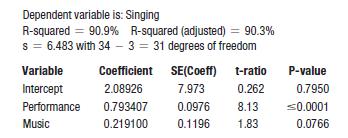
At a barbershop music singing competition, choruses are judged on three scales: Music (quality of the arrangement, etc.), Performance, and Singing. The scales are supposed to be independent of each other, and each is scored by a different judge, but a friend claims that he can predict a chorus’s
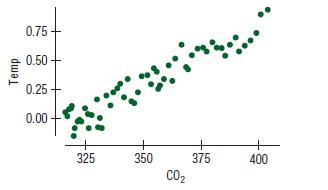
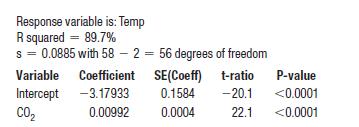
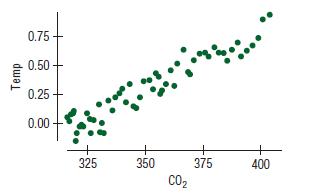
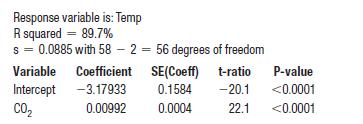
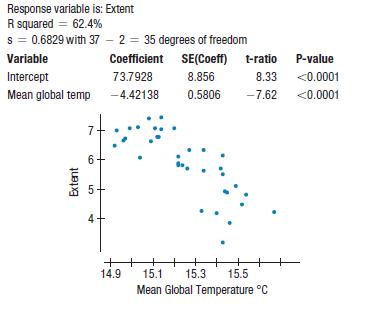
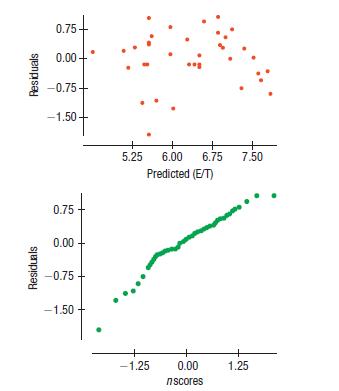
Data collected from around the globe (including the sea ice data of Exercise 23) show that the earth is getting warmer. The generally accepted explanation relates climate change to an increase in atmospheric levels of carbon dioxide (CO2) because CO2 is a greenhouse gas that traps the heat of the
We saw in Part II Review Exercise R2.21 that Old Faithful eruptions do not occur at constant intervals and the intervals may vary greatly. In that exercise, we fit a regression model, which we can now improve with t- statistics and P-values.a) State and test the natural null hypothesis for the
Consider once again the CO2 and global temperature data of Exercise 41. The mean CO2 level for these data is 352.566 ppm.a) Find a 90% confidence interval for the mean global temperature anomaly if the CO2 level reaches 450 ppm.b) Find a 90% prediction interval for the mean global
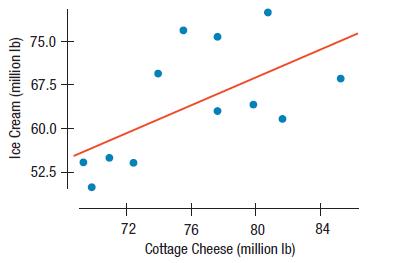
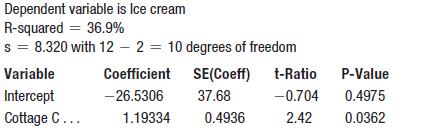
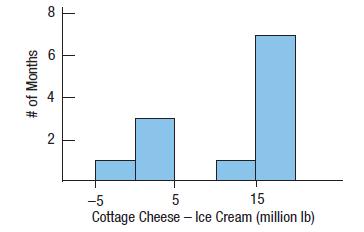
Peninsula Creameries sells both cottage cheese and ice cream. The CEO recently noticed that in months when the company sells more cottage cheese, it seems to sell more ice cream as well. Two of his aides were assigned to test whether this is true or not. The first aide’s plot and analysis of
A skeptic suggests that reduced sea ice isn’t due to global climate change at all. He offers the following model, including Year since 1979 as another predictor as an alternative to the model in Exercise 23: (Data in Sea ice):a) The coefficient of Mean global temp now has a P-value of 0.6409.
Fitting someone for a hearing aid requires assessing the patient’s hearing ability. In one method of assessment, the patient listens to a tape of 50 English words. The tape is played at low volume, and the patient is asked to repeat the words. The patient’s hearing ability score is the number
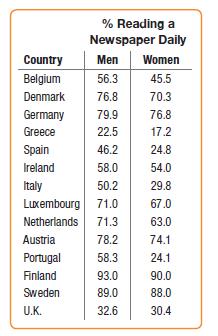
Who reads the newspaper more, men or women? Eurostat, an agency of the European Union (EU), conducts surveys on several aspects of daily life in EU countries. Recently, the agency asked samples of 1000 respondents in each of 14 European countries whether they read the newspaper on a daily basis.
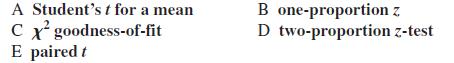
For each of the following descriptions, select the letter of the inference method you would use a) Ithaca garbage bags In Ithaca, New York, every garbage bag must be tagged and not exceed 20 lb in weight. The city wants to know whether residents comply with the rules. One day, a truck driver
Continuing from Exercise 14, the coach responds to the players by claiming that shooting accuracy is more important than time on the ice. He adds Shoot% (% of shots on goal) to the model.a) The coefficient of TOI/G in this model is quite different from the TOI/G coefficient in the previous model of
A sample of 84 model-2011 cars from an online information service was examined to see how fuel efficiency (as highway mpg) relates to the cost (Manufacturer’s Suggested Retail Price in dollars) of cars. Here are displays and computer output:a) State what you want to know, identify the variables,
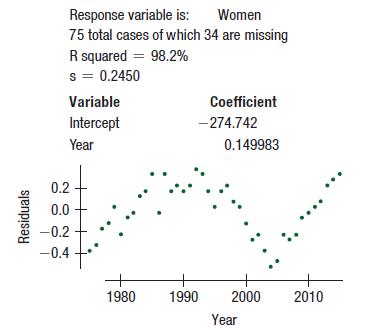
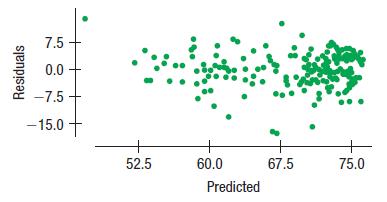
Has the trend of decreasing difference in age at first marriage seen in Exercise 42 gotten stronger recently? The scatterplot and residual plot for the data from 1980 through 2015, along with a regression for just those years, are below.a) Is this linear model appropriate for the post-1980 data?b)
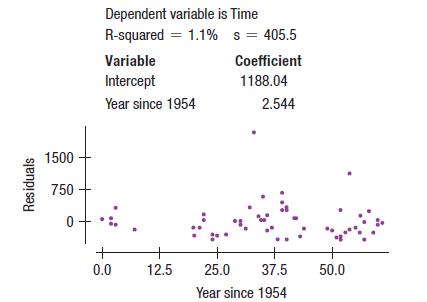
People swam across Lake Ontario from Niagara on the Lake to Toronto (52 km, or about 32.3 mi) 62 times between 1954 and 2016. We might be interested in whether the swimmers are getting any faster or slower. Here are the regression of the crossing Times (minutes) against the Year since 1954 of the
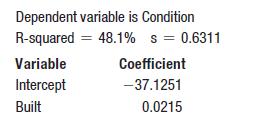
In Chapter 7, we found a relationship between the age of a bridge in Tompkins County, New York, and its condition as found by inspection. (Data in Tompkins County Bridges 2016) But we considered only bridges built or replaced since 1900. Tompkins County is the home of the oldest covered bridge in
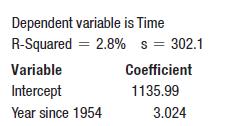
In Exercise 46, we saw in the Swim the Lake 2016 data that Vicki Keith’s round-trip swim of Lake Ontario was an obvious outlier among the other one-way times.Here is the new regression after this unusual point is removed:a) In this new model, the value of se is smaller.b) Are you more convinced
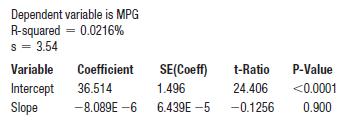
Look again at the graph of the age at first marriage for women in Exercise 42. Here is a regression model for the data on women, along with a residuals plot:a) Based on this model, what would you predict the marriage age will be for women in 2025?b) How much faith do you place in this prediction?
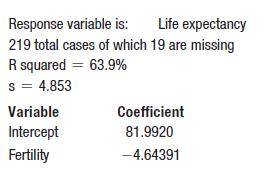
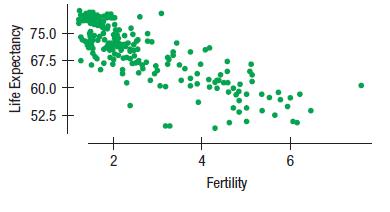
The World Bank reports many demographic statistics about countries of the world. The data file holds the Fertility rate (births per woman) and the female Life expectancy at birth (in years) for 200 countries of the world.Here is a scatterplot of the data.a) Are the conditions for regression
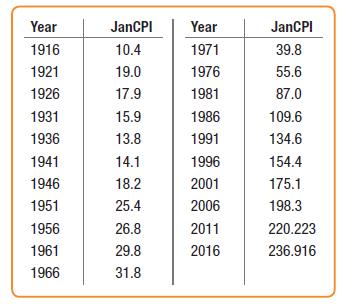
The Consumer Price Index (CPI) tracks the prices of consumer goods in the United States, as shown in the following table. The CPI is reported monthly, but we can look at selected values. The table shows the January CPI at five-year intervals. It indicates, for example, that the average item costing
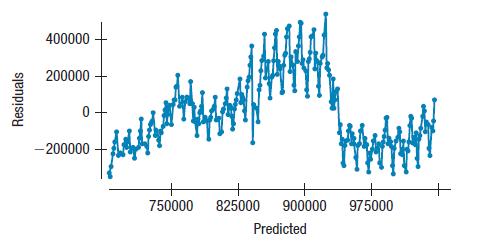
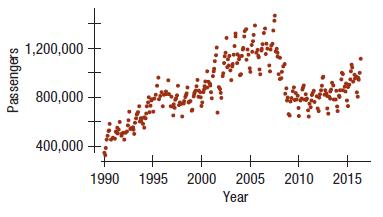
In Exercise 29, we considered whether a linear model would be appropriate to describe the trend in the number of passengers departing from the Oakland (CA) airport each month since the start of 1997. If we fit a regression model, we obtain this residual plot. We’ve added lines to show the order
Look once more at the data from Tour de France 2016. In Exercise 52, we looked at the whole history of the race, but now let’s consider just the modern era from 1967 on.a) Make a scatterplot and find the regression of Avg Speed by Year only for years from 1967 to the present. Are the conditions
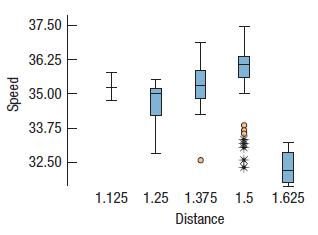
Here is a table of the 9 sun-orbiting objects formerly known as planets.a) Plot the Length of the year against the Distance from the sun. Describe the shape of your plot.b) Re-express one or both variables to straighten the plot. Use the re-expressed data to create a model describing the length of
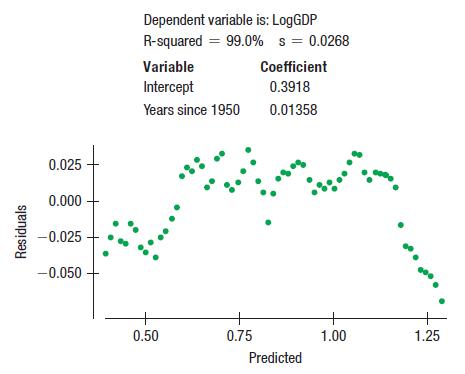
Consider again the post-1950 trend in U.S. GDP we examined in Exercise 61. Here are regression output and a residual plot when we use the log of GDP in the model. Is this a better model for GDP? Explain. Would you want to consider a different re-expression? If so, which one?
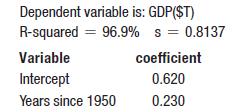
The scatterplot shows the gross domestic product (GDP) of the United States in trillions of 2009 dollars plotted against years since 1950.A linear model fit to the relationship looks like this:a) Does the value 96.9% suggest that this is a good model?b) Here’s a scatterplot of the residuals. Now
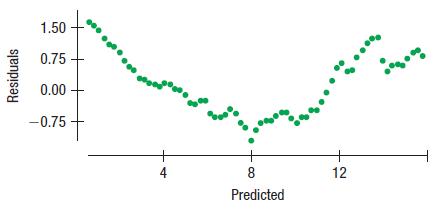
Every year, US News and World Report publishes a special issue on many U.S. colleges and universities. The scatterplots have Student/Faculty Ratio (number of students per faculty member) for the colleges and universities on the y-axes plotted against 4 other variables. The correct correlations for
Listed below are the world record men’s weightlifting performances as of 2016.a) Create a linear model for the Weight Lifted in each Weight Class, leaving out the 105+ unlimited class.b) Check the residuals plot. Is your linear model appropriate?c) Create a better model by re-expressing Weight
In January 2012, the New York Times published a story called Twin Births in the U.S., Like Never Before, in which they reported a 76 percent increase in the rate of twin births from 1980 to 2009. Here are the number of twin births each year (per 1000 live births). (www.cdc .gov/nchs/births.htm)a)
In July 2005, astronomers Mike Brown, Chad Trujillo, and David Rabinowitz announced the discovery of a sun-orbiting object, since named Eris,8 that is 5% larger than Pluto. Eris orbits the sun once every 560 earth years at an average distance of about 6300 million miles from the sun. Based on its
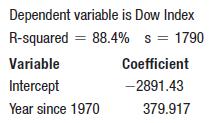
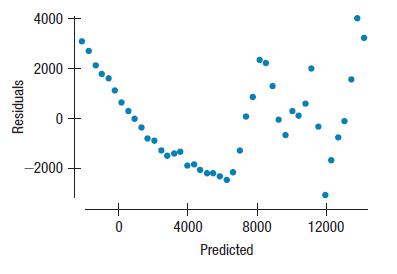
The Dow Jones stock index measures the performance of the stocks of America’s largest companies (finance.yahoo.com). A regression of the Dow prices on years 1972–2015 looks like this:a) What is the correlation between Dow Index and Year?b) Write the regression equation.c) Explain in this
Insurance companies and other organizations use actuarial tables to estimate the remaining lifespans of their customers. The data file gives life expectancy and estimated additional years of life for black males in the United States, according to a 2016 National Vital Statistics Report. (Data in
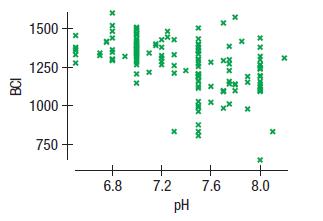
Biologists studying the effects of acid rain on wildlife collected data from 163 streams in the Adirondack Mountains. They recorded the pH (acidity) of the water and the BCI, a measure of biological diversity, and they calculated R2 = 27%. Here’s a scatterplot of BCI against pH:a) What is
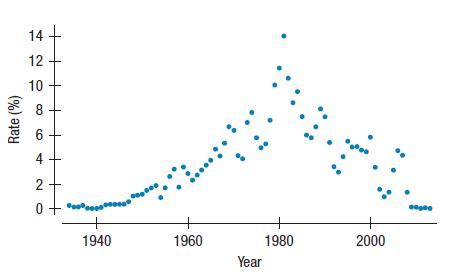
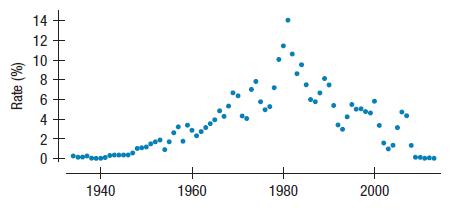
The 3-month Treasury bill interest rate is watched by investors and economists. Here’s the scatterplot of the 3-month Treasury bill rate since 1934 that we saw in Exercise 43:Clearly, the relationship is not linear. Can it be made nearly linear with a re-expression? If so, which one would you
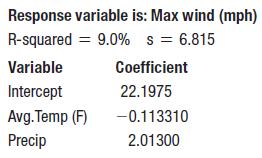
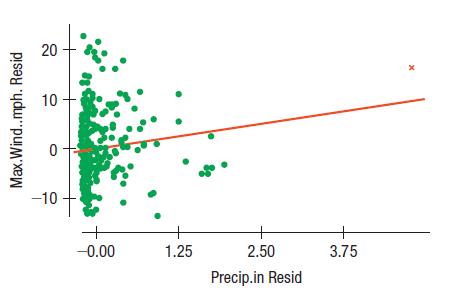
In Chapters 4 and 6 we’ve seen data from the Hopkins Forest. Here’s a regression that models the maximum daily wind speed in terms of the average temperature and precipitation: a) Write the regression model.b) What is the interpretation of the coefficient of Precip?Here is the partial
You pick a card from a standard deck and record its denomination (7, say) and its suit (maybe spades).a) Is the variable suit categorical or quantitative?b) Name a game you might be playing for which you would consider the variable denomination to be categorical.c) Name a game you might be playing
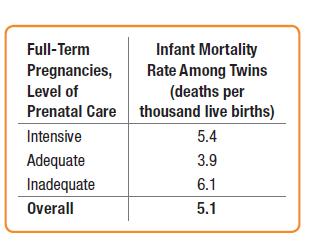
Results of a 1996 American Medical Association report about the infant mortality rate for twins carried for the full term of a normal pregnancy are shown on the next page, broken down by the level of prenatal care the mother had received.a) Is the overall rate the average of the other three rates?
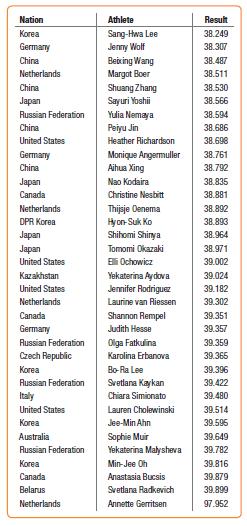
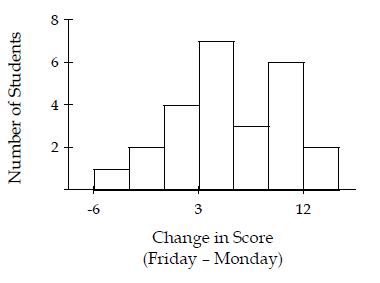
The times from the first race of the women’s 2 x 500-m speed skating timesare listed in the table below.a) The mean finishing time was 40.72 seconds, with a standard deviation of 9.82 seconds. If the Normal model is appropriate, what percent of the times should be within 5 seconds of 40.72?b)
A study by the Pew Internet & American Life Project found that 78% of U.S. residents over 16 years old read a book in the past 12 months. They also found that 21% had read an e-book using a reader or computer during that period. A newspaper reporting on these findings concluded that 99% of U.S.
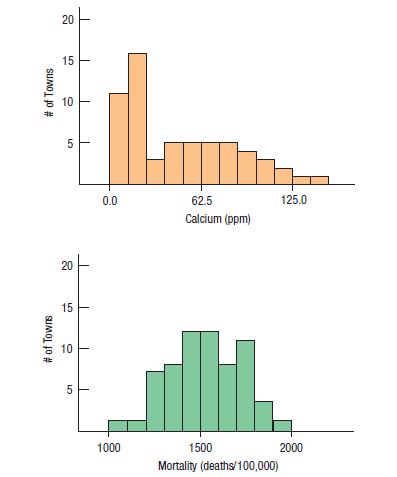
In an investigation of environmental causes of disease, data were collected on the annual mortality rate (deaths per 100,000) for males in 61 large towns in England and Wales. In addition, the water hardness was recorded as the calcium concentration (parts per million, ppm) in the drinking water.a)
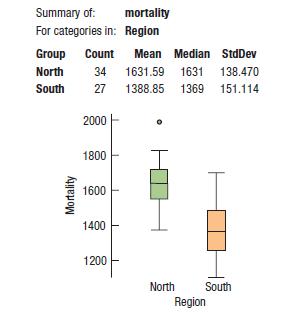
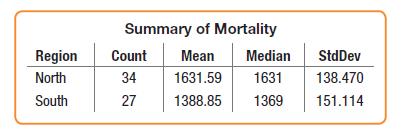
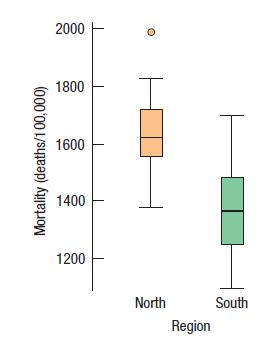
The data set from England and Wales also notes for each town whether it was south or north of Derby. Here are some summary statistics and a comparative boxplot for the two regions.a) What is the overall mean mortality rate for the two regions?b) Do you see evidence of a difference in mortality
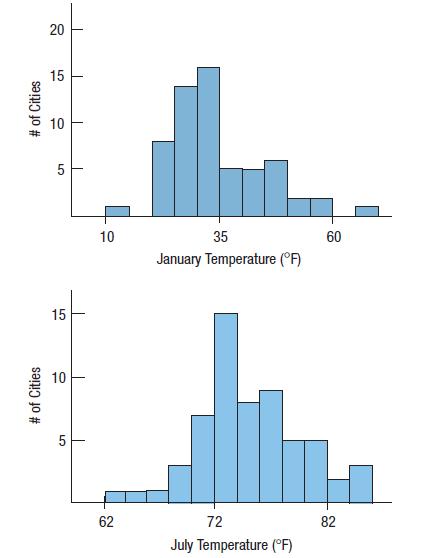
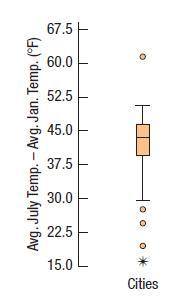
Average daily temperatures in January and July for 60 large U.S. cities are graphed in the histograms below.a) What aspect of these histograms makes it difficult to compare the distributions?b) What differences do you see between the distributions of January and July average temperatures?c)
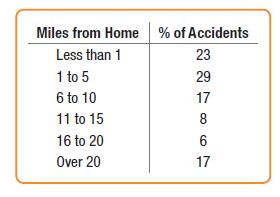
Progressive Insurance asked customers who had been involved in auto accidents how far they were from home when the accident happened. The data are summarized in the table.a) Create an appropriate graph of these data.b) Do these data indicate that driving near home is particularly dangerous? Miles
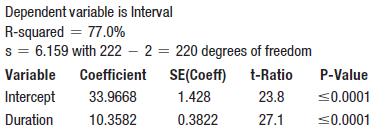
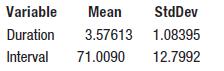
It is a common belief that Yellowstone’s most famous geyser erupts once an hour at very predictable intervals. The histogram below shows the time gaps (in minutes) between 222 successive eruptions. Describe this distribution. # of Inter-eruption Intervals 40 30 20 10 40.0 65.0 Interval (min) 90.0
Showing 5700 - 5800
of 5937
First
46
47
48
49
50
51
52
53
54
55
56
57
58
59
60
Step by Step Answers