New Semester
Started
Get
50% OFF
Study Help!
--h --m --s
Claim Now
Question Answers
Textbooks
Find textbooks, questions and answers
Oops, something went wrong!
Change your search query and then try again
S
Books
FREE
Study Help
Expert Questions
Accounting
General Management
Mathematics
Finance
Organizational Behaviour
Law
Physics
Operating System
Management Leadership
Sociology
Programming
Marketing
Database
Computer Network
Economics
Textbooks Solutions
Accounting
Managerial Accounting
Management Leadership
Cost Accounting
Statistics
Business Law
Corporate Finance
Finance
Economics
Auditing
Tutors
Online Tutors
Find a Tutor
Hire a Tutor
Become a Tutor
AI Tutor
AI Study Planner
NEW
Sell Books
Search
Search
Sign In
Register
study help
business
intro stats
Intro Stats 5th Edition Richard D De Veaux, Paul F Velleman, David E Bock, Nick Horton - Solutions
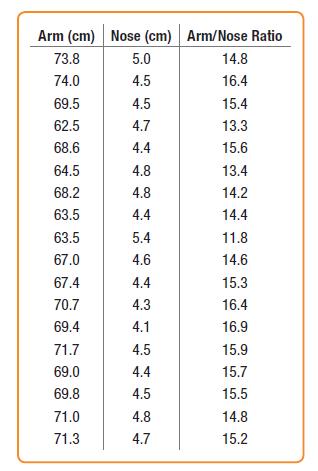
Is the Statue of Liberty’s nose too long? Her nose measures 4'6", but she is a large statue, after all. Her arm is 42 feet long. That means her arm is 42/4.5 = 9.3 times as long as her nose. Is that a reasonable ratio? Shown in the table are arm and nose lengths of 18 girls in a statistics lass,
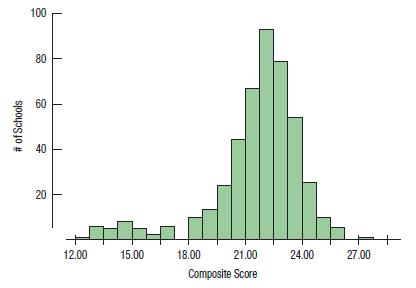
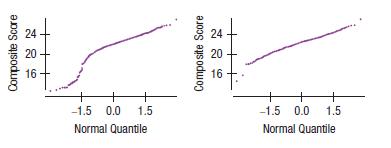
The histogram shows the distribution of mean ACT composite scores for all Wisconsin public schools in 2015. 80.1% of the data points fall between one standard deviation below the mean and one standard deviation above themean.a) Give two reasons that a Normal model is not appropriate for these
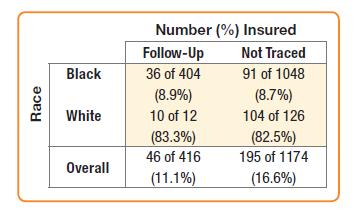
A study in South Africa focusing on the impact of health insurance identified 1590 children at birth and then sought to conduct follow-up health studies 5 years later. Only 416 of the original group participated in the 5-year follow- up study. This made researchers concerned that the follow-up
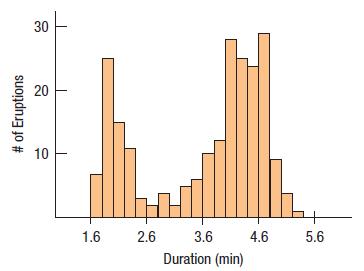
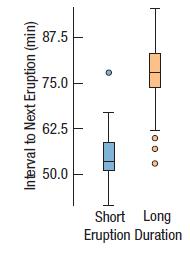
Does the duration of an eruption have an effect on the length of time that elapses before the next eruption?a) The histogram below shows the duration (in minutes) of those 222 eruptions. Describe this distribution.b) Explain why it is not appropriate to find summary statistics for this
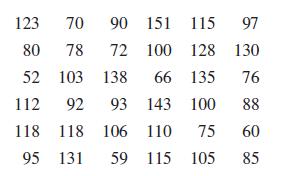
Here are the number of pieces of mail received at a school office for 36 days.a) Plot these data.b) Find appropriate summary statistics.c) Write a brief description of the school’s mail deliveries.d) What percent of the days actually lie within one standarddeviation of the mean? 123 70 90 151
The National Highway Traffic Safety Administration reported that there were 3206 fatal accidents involving drivers between the ages of 15 and 19 years old the previous year, of which 65.5% involved male drivers. Of the male drivers, 18.4% involved drinking, while of the female drivers, 10.8%
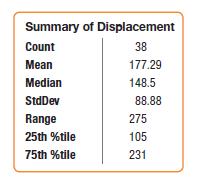
One measure of the size of an automobile engine is its “displacement,” the total volume (in liters or cubic inches) of its cylinders. Summary statistics for several models of new cars are shown. These displacements were measured in cubic inches.a) How many cars were measured?b) Why might the
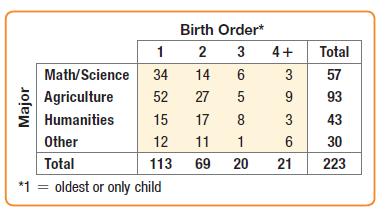
Is your birth order related to your choice of major? A statistics professor at a large university polled his students to find out what their majors were and what position they held in the family birth order. The results are summarized in the table.a) What percent of these students are oldest or
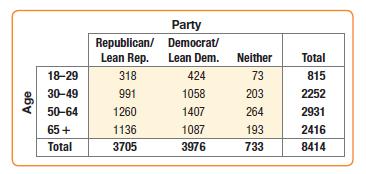
The Pew Research Center conducts surveys regularly asking respondents which political party they identify with or lean toward. Among their results is the following table relating preferred political party and age.a) What percent of people surveyed were Republicans or leaned Republican?b) Do you
Babe Ruth was the first great “slugger” in baseball. His record of 60 home runs in one season held for 34 years until Roger Maris hit 61 in 1961. Mark McGwire (with the aid of steroids) set a new standard of 70 in 1998. Listed below are the home run totals for each season McGwire played. Also
Researchers for the Herbal Medicine Council collected information on people’s experiences with a new herbal remedy for colds. They went to a store that sold natural health products. There they asked 100 customers whether they had taken the cold remedy and, if so, to rate its effectiveness (on a
Consider again the data on birth order and college majors in Exercise R1.28.a) What is the marginal distribution of majors?b) What is the conditional distribution of majors for the oldest children?c) What is the conditional distribution of majors for the children born second?d) Do you think that
According to the Bureau of Labor Statistics, the mean hourly wage for Chief Executives in 2009 was $80.43 and the median hourly wage was $77.27. By contrast, for General and Operations Managers, the mean hourly wage was $53.15 and the median was $44.55. Are these wage distributions likely to be
Consider again the Pew Research Center results on age and political party in Exercise R1.33.a) What is the marginal distribution of party affiliation?b) Create segmented bar graphs displaying the conditional distribution of party affiliation for each age group.c) Summarize these poll results in a
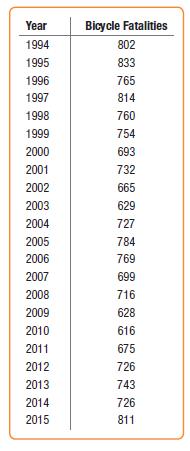
The Bicycle Helmet Safety Institute website includes a report on the number of bicycle fatalities per year in the United States. The table below shows the counts for the years 1994–2015.a) What are the W’s for these data?b) Display the data in a stem-and-leaf display.c) Display the data in a
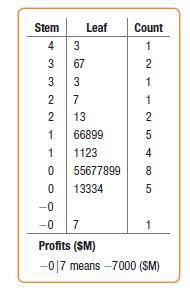
Here is a stem-and-leaf display showing profits (in $M) for 30 of the 500 largest global corporations (as measured by revenue). The stems are split; each stem represents a span of 5000 ($M), from a profit of 43,000 ($M) to a loss of 7000 ($M). Use the stem-and-leaf to answer the questions.a) Find
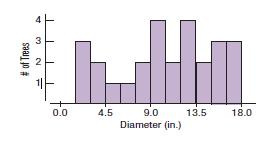
Later on, the forester in Exercise 39 shows you a histogram of the tree diameters he used in analyzing the woods that was for sale. Do you think he was justified in using a Normal model?Data From Exercise 39A forester measured 27 of the trees in a large woods that is up for sale. He found a
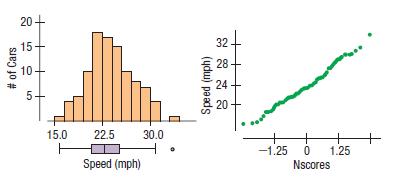
For the car speed data in Exercise 30, here are the histogram, boxplot, and Normal probability plot of the 100 readings. Do you think it is appropriate to apply a Normal model here? Explain.Data From Exercise 30John Beale of Stanford, California, recorded the speeds of cars driving past his house,
A company that markets buildit- yourself furniture sells a computer desk that is advertised with the claim “less than an hour to assemble.” However, through post purchase surveys the company has learned that only 25% of its customers succeeded in building the desk in under an hour. The mean
Exercise 10 proposes modeling IQ scores with N(100, 15). What IQ would you consider to be unusually high?Data From Exercise 10Some IQ tests are standardized to a Normal model, with a mean of 100 and a standard deviation of 15.a) Draw the model for these IQ scores. Clearly label it, showing what the
Consumer groups are concerned that cereals with a high sugar content (usually designed for children) are placed just where kids are most likely to see them—in the middle shelf of the supermarket. The variable Middle indicates whether the cereal is located on shelf 2, the middle shelf.a) Compare
Is the mean amount of salt higher in menu items that contain meat?a) Compare the sodium content of the meat and non-meat items with displays and summary statistics.b) By shuffling the variable Meat 1000 times, investigate whether the mean sodium content difference between the two groups of items
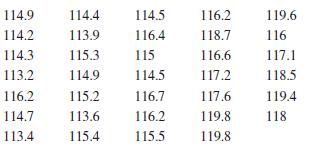
Thirty-four men completed the men’s alpine downhill part of the super combined. The gold medal winner finished in 114.9 seconds. Here are the times (in seconds) for all competitors.a) The mean time was 116.085 seconds, with a standard deviation of 1.9215 seconds. If the Normal model is
The Hopkins Forest data set includes all 24 weather variables reported by the researchers. Many of the variables (e.g., temperature, relative humidity, solar radiation, wind) are reported as daily averages, minima and maxima. Using any of these variables, compare the distributions of the daily
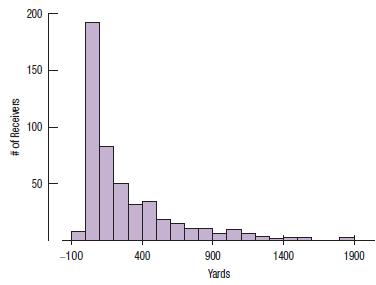
NFL data from the 2015 football season reported the number of yards gained by each of the league’s 488 receivers:The mean is 274.73 yards, with a standard deviation of 327.32 yards.a) According to the Normal model, what percent of receivers would you expect to gain more yards than 2 standard
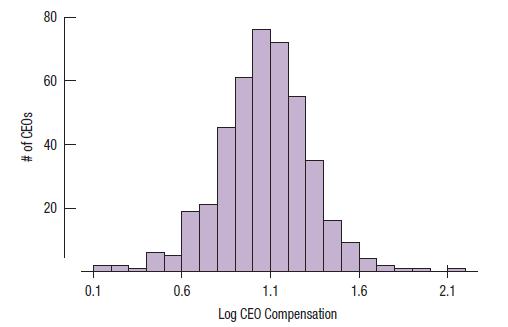
Suppose we take logarithms of the CEO compensations in Exercise 47. The histogram of log Compensation looks like this:with a mean of 1.07 and a standard deviation of 0.26.a) According to the Normal model, what percent of CEOs would you expect to earn more than 2 standard deviations above the mean
The Titanic data set includes more variables than just those discussed in Chapter 2. Others include the crew’s job and where each person boarded the ship. Stories, biographies and pictures can be found on the site: www.encyclopedia-titanica.org/. Using the data set, investigate some of the
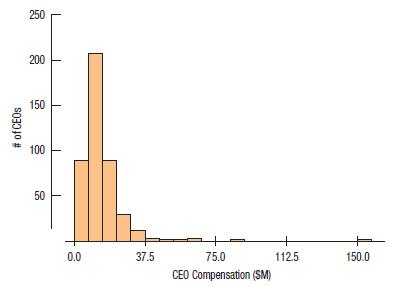
The Glassdoor Economic Research Blog published the compensation (in millions of dollars) for the CEOs of large companies. The distribution looks like this:The mean CEO compensation is $14.1M and the standard deviation is $11.32M.a) According to the Normal model, what percent of CEOs would you
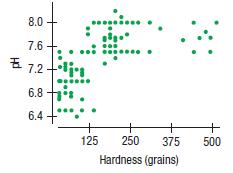
In a study of streams in the Adirondack Mountains, the following relationship was found between the water’s pH and its hardness (measured in grains):Is it appropriate to summarize the strength of association with a correlation? 8.0 7.6 표 7.2+ dis ***** 6.8 6.4 125 ****** 250 375 Hardness
The Student Survey data set introduced in the Chapter 3 exercises includes responses to 13 questions. Investigate the associations among the variables that you find interesting. Write a short report on what you discover. Be sure to include summary statistics, tables, and graphical displays.
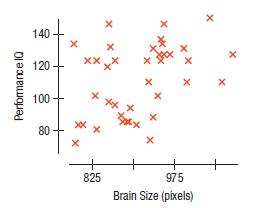
A study examined brain size (measured as pixels counted in a digitized magnetic resonance image [MRI] of a cross section of the brain) and IQ (4 performance scales of the Wechsler IQ test) for college students. The scatterplot shows the Performance IQ scores vs. Brain Size. Comment on the
The data set Movies 06-15 introduced in the Chapter 3 exercises includes the distributor, number of tickets sold, and gross revenue in addition to the MPAA rating and the genre for each of the 10 years 2006 to 2015. Investigate the associations among the variables that you find interesting. Write a
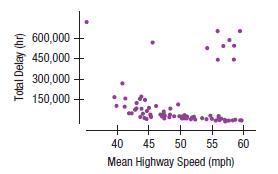
A study of traffic delays in 68 U.S. cities found the following relationship between Total Delay (in total hours lost) and Mean Highway Speed:Is it appropriate to summarize the strength of association with a correlation? €600,000 450,000 Total Delay (hr) 300,000 150,000 + + 45 50 55 40 Mean
Consider the IQ model N(100, 15) one last time.a) What IQ represents the 15th percentile?b) What IQ represents the 98th percentile?c) What’s the IQR of the IQs?
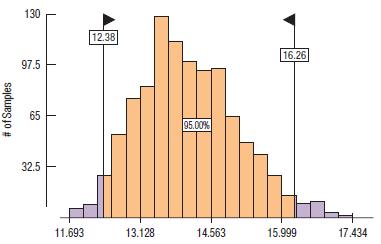
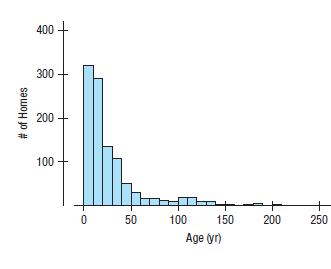
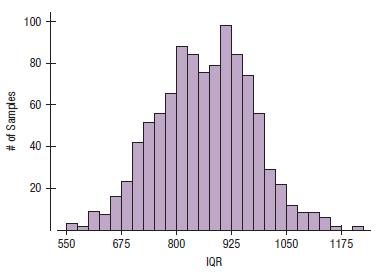
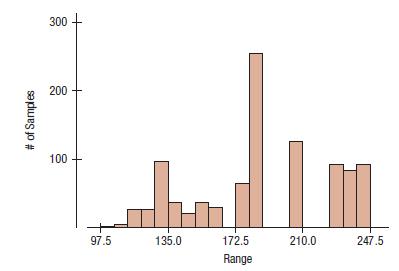
In a data set of 1057 New York homes offered for sale, a histogram of the ages looks like this:We drew 1000 samples of 105 homes from this data set and found the IQR and the range of each sample. Below are histograms of the 1000 IQRs and 1000 ranges. For which of these distributions would you use
A researcher investigating the association between two variables collected some data and was surprised when he calculated the correlation. He had expected to find a fairly strong association, yet the correlation was near 0. Discouraged, he didn’t bother making a scatterplot. Explain to him how
Students in the Economics class discussed in Exercise 31 also wrote these conclusions. Explain the mistakes they made.a) “There was a very strong correlation of 1.22 between Life Expectancy and GDP.”b) “The correlation between Literacy Rate and GDP was 0.83. This shows that countries wanting
Medical researchers followed 1435 middle-aged men for a period of 5 years, measuring the amount of Baldness present (none = 1, little = 2, some = 3, much = 4, extreme = 5) and presence of Heart Disease (No = 0, Yes = 1). They found a correlation of 0.089 between the two variables. Comment on their
Since 1994, the Best Roller Coaster Poll (www.ushsho.com/bestrollercoasterpoll.htm) has been ranking the world’s best roller coasters. In 2013, Bizarro dropped to 4th after earning the top steel coaster rank for six straight years. Data on the top 14 steel coasters from this poll are at the
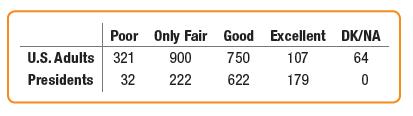
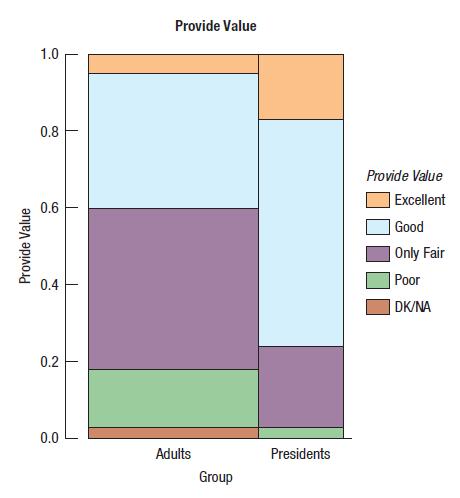
The Pew Research Center asked 2143 U.S. adults and 1055 college presidents to “rate the job the higher education system is doing in providing value for the money spent by students and their families” as Excellent, Good, Only Fair, or Poor.a) What percent of college presidents think that higher
A professor (of something other than statistics!) distributed the following histogram to show the distribution of grades on his 200-point final exam. Comment on the display. # of Students 50 40 30 20 10 50 100 150 Final Grade 200
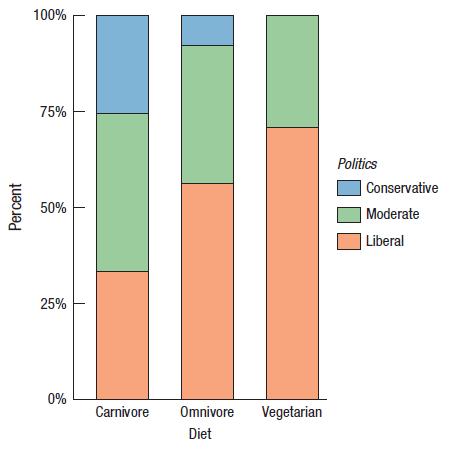
The survey of 299 undergraduate students from Exercise 86 in Chapter 2 (data in Student Survey) asked about respondents’ diet preference (Carnivore, Omnivore, Vegetarian) and political alignment (Liberal, Moderate, Conservative). Here is a stacked bar chart of the 285 responses:a) Describe what
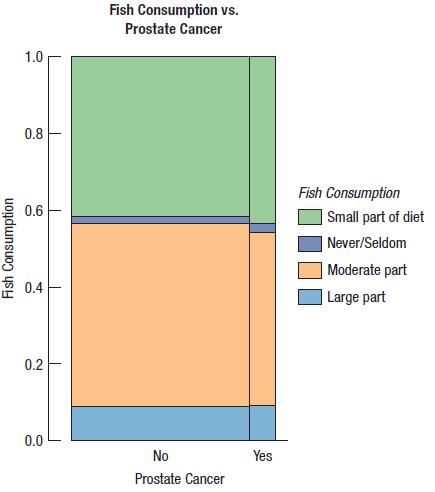
Here is a mosaic plot of the data on Fish consumption and Prostate cancer from the Step-by-Step Example on page 72.a) From the mosaic plot, about what percent of all men in this survey were diagnosed with prostate cancer?b) Are there more men who had cancer and never/seldom ate fish, or more who
Consider the survey data in Exercise 1. a) What is the conditional distribution (in percents) of college presidents’ opinions about the value of college?b) Find the conditional distribution of the opinions of U.S. adults when the categories are combined into Negative (poor), Middle (only
Here are the same data as in Exercise 5 but displayed differently:a) Describe what this plot shows using the concept of a conditional distribution.b) Do you think the differences here are real? Explain.Data From Exercise 5The survey of 299 undergraduate students from Exercise 86 in Chapter 2 (data
In 2015, the website NewGeography.com listed its ranking of the best cities for job growth in the United States. The magazine’s top 20 large cities, along with their weighted job rating indices, are given in the table. The full data set contains 70 cities
Here is a mosaic plot of the data from Exercise 1 on whether college provides value from a survey of U.S. adults and college presidents:a) From the mosaic plot, about what percent of the respondents were college presidents?b) From the mosaic plot, is it easy to see if there more U.S. adults who
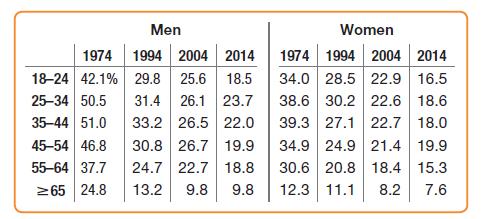
The Centers for Disease Control and Prevention provide data on smoking rates by year and for men and women separately. Here is a table with some of that information:a) What was the smoking rate among 18–24-year-old men in 1974?b) How has the smoking rate among 18–24-year-old men changed from
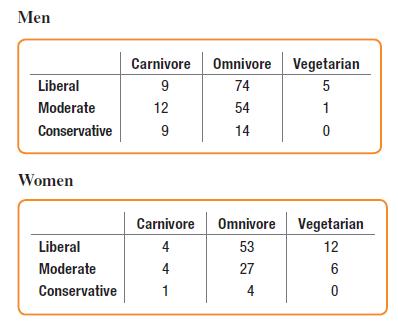
Are the patterns seen in Exercises 5 and 6 relating diet to political opinion the same for men and women? Here are two contingency tables:Data From Exercise 5The survey of 299 undergraduate students from Exercise 86 in Chapter 2 (data in Student Survey) asked about respondents’ diet preference
The data set Student survey contains 299 responses to a student survey from a statistics project. The questions asked included:◆ How would you rate yourself politically? (1 = Far left, 9 = Far right)◆ What is your gender?◆ Do you believe in God?◆ Pick a random number from 1 to 10.◆ What
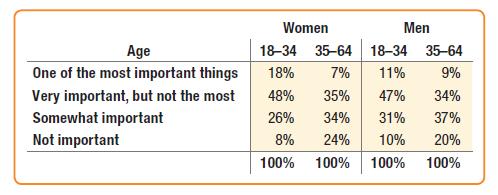
In a random sample of U.S. adults surveyed in December 2011, Pew Research asked how important it is “to you personally” to be successful in a high-paying career or profession. Here is a table reporting the responses. (Percentages may not add to 100% due to rounding.) (Data from
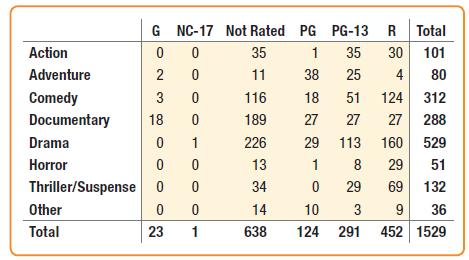
The following table summarizes 1529 films from 2014 and 2015 that have been classified into a genre and have a MPAA rating.a) What percent of these films were rated R?b) What percent of these films were R-rated comedies?c) What percent of R-rated films were comedies?d) What percent of comedies were
Look again at the table of smoking prevalence in exercise 19.a) Compare the smoking rate among 18–24-year-old women to that of men during the time covered by this table.b) Relatively few women over the age of 65 smoke. What other variables might affect this percentage?Data From Exercise 19The
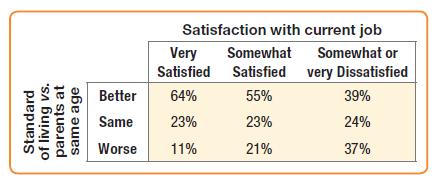
Pew Research surveyed 5006 U.S. adults to ask their opinions about the state of jobs in the United States in 2016 (www.pewsocialtrends.org/2016/10/06/the-state-ofamerican- jobs/) Respondents were asked how satisfied they are with their current job and how their current standard of living compares
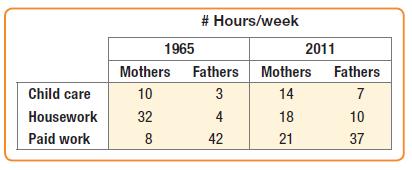
Pew Research (www .pewsocialtrends.org/2013/03/14/modern-parenthood-roles-ofmoms- and-dads-converge-as-they-balance-work-and-family/) surveyed parents and asked how many hours they spent in various activities. They compared 2011 responses with those from a 1965 survey. Here are the results:a) What
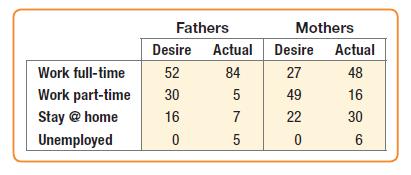
The New York Times combined survey data (economix.blogs.nytimes.com/2013/ 07/10/working-parents-wanting-fewer-hours/) with data from the U.S. Bureau of Labor Statistics (BLS) (www.bls.gov/news .release/archives/famee_04262013.htm) comparing how mothers and fathers would like to allocate their time
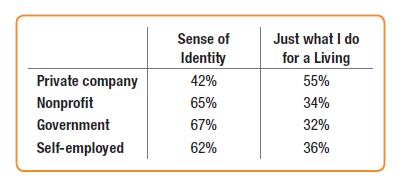
The Pew Research survey cited in Exercise 27 also asked what employment sector the respondents worked in and whether their job gave them a sense of identity or whether it was “just what they do for a living.” This table summarizes their responses:a) Is this a table of row percents, column
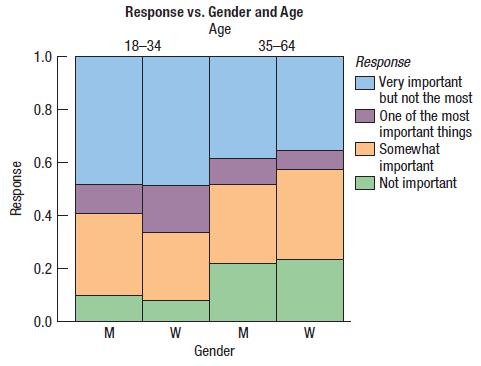
Here is a mosaic plot of the data on being successful from Exercise 10:a) Are the differences in sample sizes in the four groups very large?b) Which factor seems more important in determining how someone responded: Age or Gender?c) Judging by the top two categories of importance, which of the four
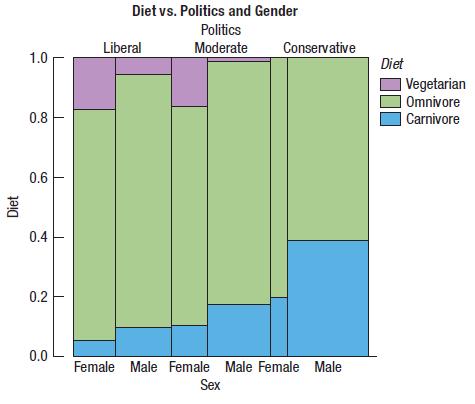
Here is a mosaic plot of the data on Diet and Politics from Exercise 5 combined with data on Gender.Data From Exercise 5The survey of 299 undergraduate students from Exercise 86 in Chapter 2 (data in Student Survey) asked about respondents’ diet preference (Carnivore, Omnivore, Vegetarian) and
A recent article in Geophysical Research Letters (Asteroid impact effects and their immediate hazards for human populations, 10.1002/2017GL073191) simulated the consequences of an earth impact by an asteroid of 400m in diameter. They estimate that for a land impact, 60% of deaths would be caused by
In Exercise 5 you were asked whether you thought the differences in political identification across diet preferences were real. To examine that question further, we randomly scrambled the students’ politics preferences and created 8 new bar charts of these scrambled distributions (see below).a)
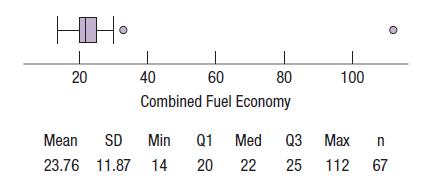
The boxplot shows the fuel economy ratings for 67 model year 2012 subcompact cars. Some summary statistics are also provided. The extreme outlier is the Mitsubishi i-MiEV, an electric car whose electricity usage is equivalent to 112 miles per gallon. •HIH 20 L 40 1 80 60 Combined Fuel
In Exercise 8 you were asked to compare the responses of college presidents and all U.S. adults to the question about the value of a college education. To examine that question further, we randomly scrambled the responses and created 15 new mosaic plots of these scrambled distributions.a) Can you
Here is a display of the international load factors by month for the period from 2000 to 2016:Discuss the patterns you see in this display. International Load Factor 82.5 75.0 67.5 60.0 T | T 0 臣。 HOH 。 H 。 } HI 轉 1 2 3 4 5 6 7 8 9 10 11 12 Month
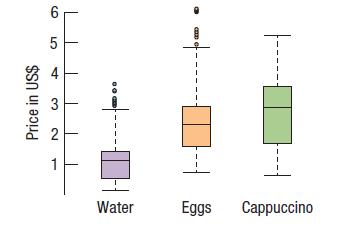
Here are the same three prices as in Exercise 15 but for 576 cities around the world.a) In general, which commodity is the most expensive?b) Is a carton of eggs ever more expensive than a cappuccino? Price in US$ 6 5 ند 2 1 Water • can Eggs Cappuccino
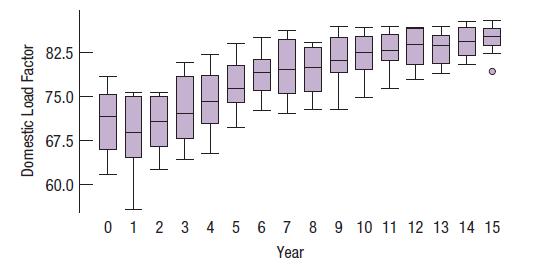
Here is a display of the domestic load factors by year through 2015:Discuss the patterns you see in this display. Domestic Load Factor 82.5 75.0 67.5 60.0 T Տրոիզըծո PRRes: T 0 1 2 3 4 5 6 7 8 9 10 11 12 13 14 15 Year
Discoveries of planets beyond our solar system have grown rapidly. Here is a histogram showing the distance (in lightyears) from earth to stars that have known planets (as of 2016):Explain why it might be beneficial to re-express these distances. Planets 40 30 20 10 14 0 1000 =+ 3000 Distance
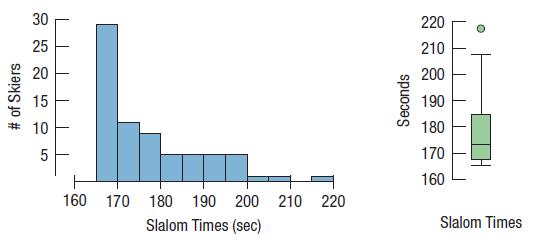
The Men’s Giant Slalom skiing event consists of two runs whose times are added together for a final score. Two displays of the giant slalom times in the 2014 Winter Olympics at Sochi are shown below.a) What features of the distribution can you see in both the histogram and the boxplot?b) What
Look at the boxplots by month in Exercise 5. The long low whisker for the year 2001 is due to the terrorist attacks of 9/11. Do you think the data for the months affected by that attack should be set aside in any overall analysis of load factors?Data From Exercise 5Here is a display of the
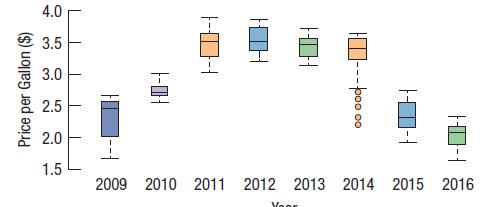
Here are boxplots of weekly gas prices for regular gas in the United States as reported by the U.S. Energy Information Administration for 2009 through August 2016:a) Compare the distribution of prices over the eight years.b) Compare the stability of prices over the eight years. Price per Gallon
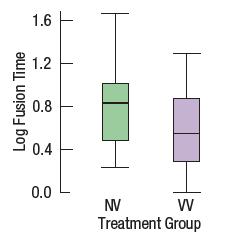
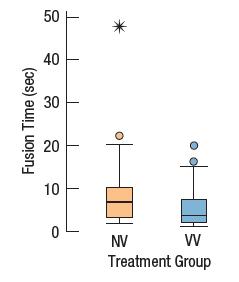
Because of the skewness of the distributions of fusion times described in Exercise 49, we might consider a re-expression. Here are the boxplots of the log of fusion times. Is it better to analyze the original fusion times or the log fusion times?Data From Exercise 49Stereograms appear to be
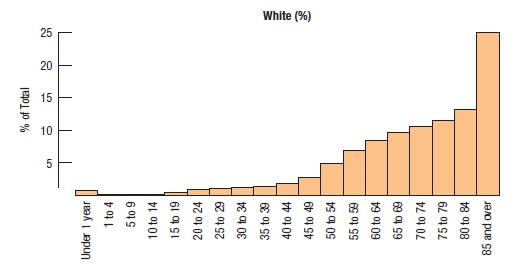
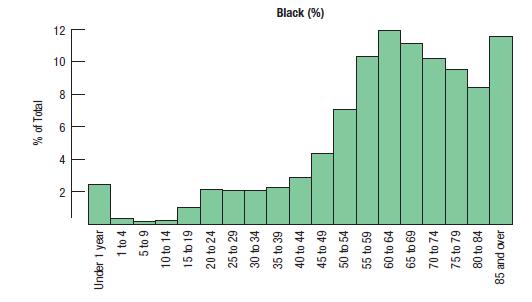
A National Vital Statistics Report (www.cdc.gov/nchs/) provides information on deaths by age, sex, and race. Below are displays of the distributions of ages at death for White and Black males:a) Describe the overall shapes of these distributions.b) How do the distributions differ?c) Look carefully
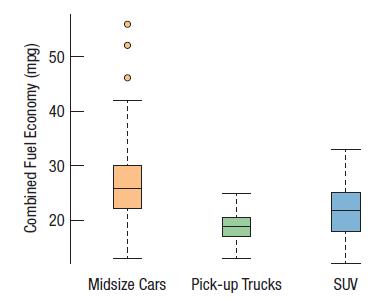
The U.S. Department of Energy (www. fueleconomy.gov/feg/download.shtml) provides fuel economy and pollution information on over 1200 2016 car models. Here is a boxplot of Combined Fuel Economy (using an average of driving conditions) in miles per gallon by the 596 models whose Class is one of the
From Exercise 16 it appeared that the mean cost of a cappuccino was slightly higher than the mean cost of a dozen eggs. Given the variation among the prices, could that difference be due just to chance? To examine that further, we took 1000 random samples of 100 cities and computed the difference
From Exercise 50 it appeared that the mean log fusion time for the VV group was greater than that of the NV group. Could the difference be due to chance? The histogram below shows the difference in the means of the log fusion times by randomly selecting two groups (ignoring the group labels) 1000
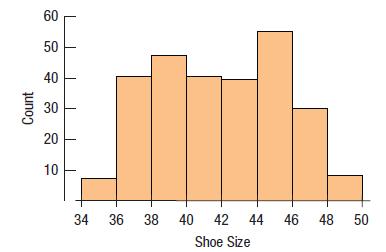
In Chapter 2 (Exercise 16) we saw data on shoe sizes of students, reported in European sizes. For the men, the mean size was 44.65 with a standard deviation of 2.03. To convert euro shoe sizes to U.S. sizes for men, use the equation US size = Euro Size x 0.7865 - 24.a) What is the mean men’s shoe
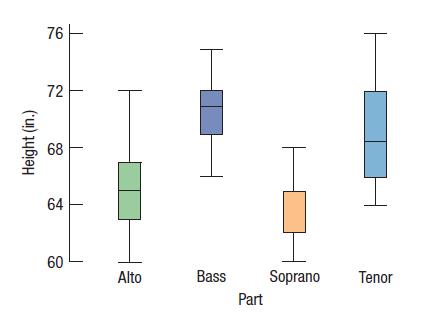
The boxplots display the heights (in inches) of 130 members of a choir by the part they sing.a) It appears that the median height for sopranos is missing, but actually the median and the upper quartile are equal. How could that happen?b) Write a few sentences describing what you see. These boxplots
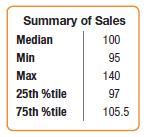
Clarksburg Bakery is trying to predict how many loaves to bake. In the past 100 days, they have sold between 95 and 140 loaves per day. Here is a histogram of the number of loaves they sold for the past 100 days.a) Describe the distribution.b) Which should be larger, the mean number of sales or the
In a study of dialysis, researchers found that “of the three patients who were currently on dialysis, 67% had developed blindness and 33% had their toes amputated.” What kind of display might be appropriate for these data? Explain.
Beanstalk Clubs are social clubs for very tall people. To join, a man must be over 6'2"tall, and a woman over 5'10". The National Health Survey suggests that heights of adults may be Normally distributed, with mean heights of 69.1" for men and 64.0" for women. The respective standard deviations are
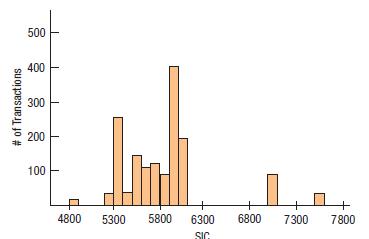
A credit card bank is investigating the incidence of fraudulent card use. The bank suspects that the type of product bought may provide clues to the fraud. To examine this situation, the bank looks at the North American Industry Classification System (NAICS) of the business related to the
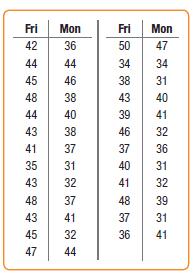
One Thursday, researchers gave students enrolled in a section of basic Spanish a set of 50 new vocabulary words to memorize. On Friday, the students took a vocabulary test. When they returned to class the following Monday, they were retested—without advance warning. Both sets of test scores for
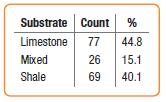
As part of the course work, a class at an upstate NY college collects data on streams each year. Students record a number of biological, chemical, and physical variables, including the stream name, the substrate of the stream (limestone (L), shale (S), or mixed (M)), the pH, the temperature (°C),
Public relations staff members at State U. phoned 850 local residents. After identifying themselves, the callers asked the survey participants their ages, whether they had attended college, and whether they had a favorable opinion of the university. The official report to the university’s
The shoe size data for women has a mean of 38.46 and a standard deviation of 1.84. To convert to U.S. sizes, use US size = Euro Size x 0.7865 - 22.5.a) What is the mean women’s shoe size for these respondents in U.S. units?b) What is the standard deviation in U.S. units?
Based on long-term investigation, researchers have suggested that the acidity (pH) of rainfall in the Shenandoah Mountains can be described by the Normal model N(4.9, 0.6).a) Draw and carefully label the model.b) What percent of storms produce rainfall with pH over 6?c) What percent of storms
One of the authors has an adopted grandson whose birth family members are very short. After examining him at his 2-year checkup, the boy’s pediatrician said that the z-score for his height relative to American 2-year-olds was -1.88. Write a sentence explaining what that means.
For the shoe sizes in Exercise 16, what might be the problem with either the standard deviation or the IQR as a measure of spread?Data From Exercise 16A last is a form, traditionally made of wood, in the shape of the human foot. Lasts of various sizes are used by shoemakers to make shoes. In the
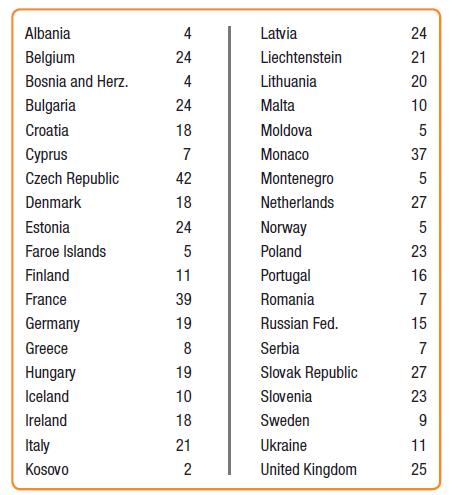
In 2015 the Council of Europe published a report entitled The European School Survey Project on Alcohol and Other Drugs (www.espad.org). Among other issues, the survey investigated the percentages of 16-year-olds who had used marijuana. Shown here are the results for 38 European countries. Create
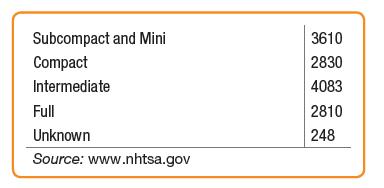
The table gives the numbers of passenger car occupants killed in accidents in 2011 by car type.Convert this table to a relative frequency table. Subcompact and Mini Compact Intermediate Full Unknown Source: www.nhtsa.gov 3610 2830 4083 2810 248
The frequencies of traffic fatalities of nonoccupants of vehicles are shown in the following bar chart. (www.the-numbers.com/research-analysis) Change this to a bar chart of relative frequencies. 5000 4000 3000 2000 1000 0 Nonoccupant Fatalities 4735 Pedestrian 743 Pedalcyclist 190 Other
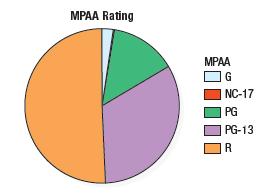
The Motion Picture Association of America (MPAA) rates each film to designate the appropriate audience. The ratings are G, PG, PG-13, and R. The pie chart shows the MPAA ratings of the same 891 movies released in 2014 and 2015 as in Exercise 3.a) Is this an appropriate display for the ratings? Why
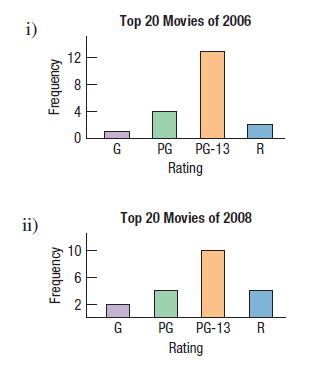
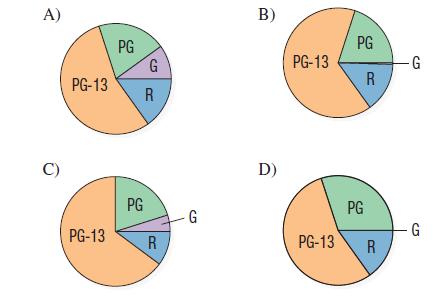
The ratings of the 20 top-grossing movies in the years 2006, 2008, 2012, and 2014 are shown in the following bar charts. The pie charts show the same data but are unlabeled. Match each pie chart with the correct year. i) ii) Frequency Frequency 12 CO 4 0 6 2 Top 20 Movies of 2006 G PG PG-13
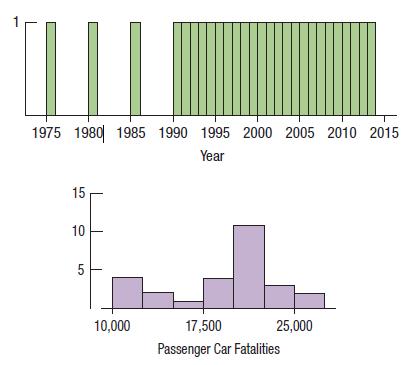
Here are two histograms showing the annual number of traffic fatalities in passenger cars. (NHTSA) One plots the years, and the other plots the fatalities.a) There are gaps in the histogram for Year. What do they indicate?b) Why are all the bars in the Year histogram the same height?c) Explain what
The National Center for Health Statistics (NCHS) conducts an extensive survey consisting of an interview and medical examination with a representative sample of about 5000 people a year. The interview includes demographic, socioeconomic, dietary, and other health-related questions. The examination
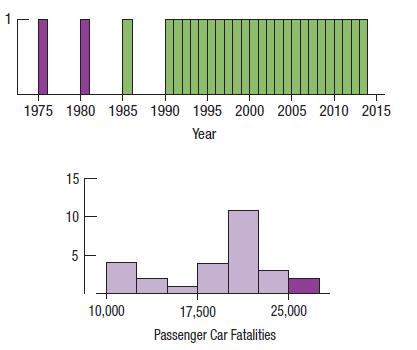
Here are the same histograms as in Exercise 7. However, the two groups of fatalities have been highlighted, and the corresponding bars in the Year histogram are also highlighted.a) How many years are included in the highlighted bar in the Passenger car fatalities histogram?b) Which years are
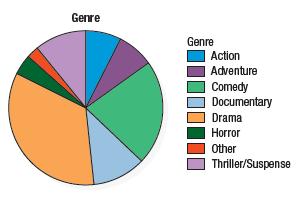
The pie chart summarizes the genres of the 891 MPAA rated movies released in 2014 and 2015.a) Is this an appropriate display for the genres? Why or why not?b) Which category was least common? Genre Genre Action Adventure Comedy Documentary Drama Horror Other Thriller/Suspense
Some companies offer 401(k) retirement plans to employees, permitting them to shift part of their before-tax salaries into investments such as mutual funds. Employers typically match 50% of the employees’ contribution up to about 6% of salary. One company, concerned with what it believed was a
The Cleveland Casting Plant is a large, highly automated producer of gray and nodular iron automotive castings for Ford Motor Company. The company is interested in keeping the pouring temperature of the molten iron (in degrees Fahrenheit) close to the specified value of 2550 degrees. Cleveland
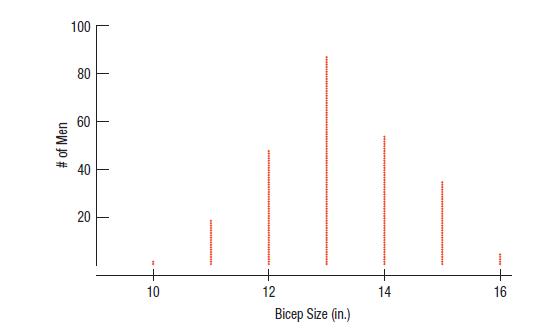
A study of body fat on 250 men collected measurements of 12 body parts as well as the percentage of body fat that the men carried. Here is a dotplot of their bicep circumferences (in inches). What does the dotplot say about the distribution of the size of men’s biceps? # of
Showing 5800 - 5900
of 5937
First
46
47
48
49
50
51
52
53
54
55
56
57
58
59
60
Step by Step Answers