New Semester
Started
Get
50% OFF
Study Help!
--h --m --s
Claim Now
Question Answers
Textbooks
Find textbooks, questions and answers
Oops, something went wrong!
Change your search query and then try again
S
Books
FREE
Study Help
Expert Questions
Accounting
General Management
Mathematics
Finance
Organizational Behaviour
Law
Physics
Operating System
Management Leadership
Sociology
Programming
Marketing
Database
Computer Network
Economics
Textbooks Solutions
Accounting
Managerial Accounting
Management Leadership
Cost Accounting
Statistics
Business Law
Corporate Finance
Finance
Economics
Auditing
Tutors
Online Tutors
Find a Tutor
Hire a Tutor
Become a Tutor
AI Tutor
AI Study Planner
NEW
Sell Books
Search
Search
Sign In
Register
study help
business
intro stats
Stats Data And Models (Subscription) 3rd Edition Richard D De Veaux, Paul D Velleman, David E Bock - Solutions
A-Rod 2009. Alex Rodriguez (known to fans as A-Rod)was the youngest player ever to hit 500 home runs. Here is a stem-and-leaf display of the number of home runs hit by A-Rod during the 1994–2009 seasons. Describe the distribution, mentioning its shape and any unusual features. 5|247 41 2278 3
Wayne Gretzky. In Exercise 34, you examined the number of games played by hockey great Wayne Gretzky during his 20-year career in the NHL.a) Would you use the median or the mean to describe the center of this distribution? Why?b) Find the median.c) Without actually finding the mean, would you
States. The stem-and-leaf display shows populations of the 50 states and Washington, DC, in millions of people, according to the 2000 census.a) What measures of center and spread are most appropriate?b) Without doing any calculations, which must be larger:the median or the mean? Explain how you
The Great One. During his 20 seasons in the NHL, Wayne Gretzky scored 50% more points than anyone who ever played professional hockey. He accomplished this amazing feat while playing in 280 fewer games than Gordie Howe, the previous record holder. Here are the number of games Gretzky played during
Gasoline. In March 2006, 16 gas stations in Grand Junction, CO, posted these prices for a gallon of regular gasoline:2.22 2.21 2.45 2.24 2.27 2.28 2.27 2.23 2.26 2.46 2.29 2.32 2.36 2.38 2.33 2.27a) Make a stem-and-leaf display of these gas prices. Use split stems; for example, use two 2.2
Singers. The frequency table shows the heights (in inches) of 130 members of a choir.a) Find the median and IQR.b) Find the mean and standard deviation.c) Display these data with a histogram.d) Write a few sentences describing the distribution. Height Count Height Height Count 60 2 69 5 61 6 70 11
Payroll. Asmall warehouse employs a supervisor at $1200 a week, an inventory manager at $700 a week, six stock boys at $400 a week, and four drivers at $500 a week.a) Find the mean and median wage.b) How many employees earn more than the mean wage?c) Which measure of center best describes a typical
Cold weather. A meteorologist preparing a talk about global warming compiled a list of weekly low temperatures(in degrees Fahrenheit) he observed at his southern Florida home last year. The coldest temperature for any week was but he inadvertently recorded the Celsius value of Assuming that he
Movie budgets. The histogram shows the budgets (in millions of dollars) of major release movies in 2005.An industry publication reports that the average movie costs $35 million to make, but a watchdog group concerned with rising ticket prices says that the average cost is $46.8 million. What
Golf drives II. Exercise 26 looked at distances PGA golfers can hit the ball. The standard deviation of these average drive distances is 9.3 yards, and the quartiles are yards and yards.a) Write a sentence or two describing the spread in distances based on i) the quartiles.ii) the standard
Movie lengths II. Exercise 25 looked at the running times of movies released in 2005. The standard deviation of these running times is 19.6 minutes, and the quartiles are minutes and minutes.a) Write a sentence or two describing the spread in running times based on i) the quartiles.ii) the standard
Golf drives. The display shows the average drive distance (in yards) for 202 professional golfers on the men’s PGA tour.a) Describe this distribution.b) Approximately what proportion of professional male golfers drive, on average, less than 280 yards?c) Estimate the mean by examining the
Movie lengths. The histogram shows the running times in minutes of 122 feature films released in 2005.a) You plan to see a movie this weekend. Based on these movies, how long do you expect a typical movie to run?b) Would you be surprised to find that your movie ran for hours (150 minutes)?c) Which
Neck sizes again. Look again at the histogram of men’s neck sizes in Exercise 22.a) Is the mean closer to 14, 15, or 16 inches? Why?b) Is the standard deviation closer to 1 inch, 3 inches, or 5 inches? Explain.
Pizza prices again. Look again at the histogram of the pizza prices in Exercise 21.a) Is the mean closer to $2.40, $2.60, or $2.80? Why?b) Is the standard deviation closer to $0.15, $0.50, or$1.00? Explain.
Neck size. The histogram shows the neck sizes (in inches) of 250 men recruited for a health study in Utah.Which summary statistics would you choose to summarize the center and spread in these data? Why? No. of Men 60 50 40 30 20 10 0 12 13 14 15 16 17 Neck Size (inches)
Pizza prices. The histogram shows the distribution of the prices of plain pizza slices (in $) for 156 weeks in Dallas, TX.Which summary statistics would you choose to summarize the center and spread in these data? Why? 30 30 20 20 Frequency 10 0 2.2 2.4 2.6 Price 2.8 3.0
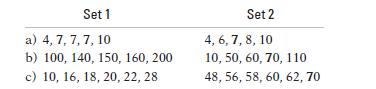
Standard deviation II. For each lettered part, a through c, examine the two given sets of numbers. Without doing any calculations, decide which set has the larger standard deviation and explain why. Then check by finding the standard deviations by hand. Set 1 a) 4, 7, 7, 7, 10 b) 100, 140, 150,
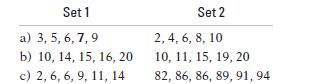
Standard deviation I. For each lettered part, a through c, examine the two given sets of numbers. Without doing any calculations, decide which set has the larger standard deviation and explain why. Then check by finding the standard deviations by hand. Set 1 a) 3,5,6,7,9 b) 10, 14, 15, 16, 20 c) 2,
Sick days. During contract negotiations, a company seeks to change the number of sick days employees may take, saying that the annual “average” is 7 days of absence per employee. The union negotiators counter that the “average” employee misses only 3 days of work each year. Explain how both
Mistake. A clerk entering salary data into a company spreadsheet accidentally put an extra “0” in the boss’s salary, listing it as $2,000,000 instead of $200,000. Explain how this error will affect these summary statistics for the company payroll:a) measures of center: median and mean.b)
Tornadoes 2008. Here are the annual numbers of deaths from tornadoes in the United States from 1998 through 2008 (Source: NOAA):130 94 40 40 555 54 35 38 67 81 125 Find these statistics by hand (no calculator!):a) meanb) median and quartilesc) range and IQR
Summaries. Here are costs of 10 electric smoothtop ranges rated very good or excellent by Consumer Reports in August 2002.$850 900 1400 1200 1050 1000 750 1250 1050 565 Find these statistics by hand (no calculator!):a) meanb) median and quartilesc) range and IQR
Super Bowl wins. In the Super Bowl, by how many points does the winning team outscore the losers? Here are the winning margins for the first 43 Super Bowl games:25, 19, 9, 16, 3, 21, 7, 17, 10, 4, 18, 17, 4, 12, 17, 5, 10, 29, 22, 36, 19, 32, 4, 45, 1, 13, 35, 17, 23, 10, 14, 7, 15, 7, 27, 3, 27,
Super Bowl points. How many points do football teams score in the Super Bowl? Here are the total numbers of points scored by both teams in each of the first 43 Super Bowl games:45, 47, 23, 30, 29, 27, 21, 31, 22, 38, 46, 37, 66, 50, 37, 47, 44, 47, 54, 56, 59, 52, 36, 65, 39, 61, 69, 43, 75, 44,
E-mails. A university teacher saved every e-mail received from students in a large Introductory Statistics class during an entire term. He then counted, for each student who had sent him at least one e-mail, how many e-mails each student had sent.a) From the histogram, would you expect the mean or
Heart attack stays. The histogram shows the lengths of hospital stays (in days) for all the female patients admitted to hospitals in New York during one year with a primary diagnosis of acute myocardial infarction (heart attack).a) From the histogram, would you expect the mean or median to be
Run times. One of the authors collected the times (in minutes) it took him to run 4 miles on various courses during a 10-year period. Here is a histogram of the times.Describe the distribution and summarize the important features. What is it about running that might account for the shape you see?
Vineyards. The histogram shows the sizes (in acres) of 36 vineyards in the Finger Lakes region of New York.a) Approximately what percentage of these vineyards are under 60 acres?b) Write a brief description of this distribution (shape, center, spread, unusual features). 15 10 # of Vineyards 5 0 120
Singers. The display shows the heights of some of the singers in a chorus, collected so that the singers could be positioned on stage with shorter ones in front and taller ones in back.a) Describe the distribution.b) Can you account for the features you see here? 20 # of Singers 10 15 60 68 Height
Sugar in cereals. The histogram displays the sugar content (as a percent of weight) of 49 brands of breakfast cereals.a) Describe this distribution.b) What do you think might account for this shape? CO 9 st # of Cereals 2 08 16 24 32 40 48 56 Sugar (%)
More shapes. Would you expect distributions of these variables to be uniform, unimodal, or bimodal?Symmetric or skewed? Explain why.a) Ages of people at a Little League game.b) Number of siblings of people in your class.c) Pulse rates of college-age males.d) Number of times each face of a die shows
Thinking about shape. Would you expect distributions of these variables to be uniform, unimodal, or bimodal?Symmetric or skewed? Explain why.a) The number of speeding tickets each student in the senior class of a college has ever had.b) Players’ scores (number of strokes) at the U.S. Open golf
In the news II. Find an article in a newspaper, a magazine, or the Internet that discusses a measure of spread.a) Does the article discuss the W’s for the data?b) What are the units of the variable?c) Does the article use the range, IQR, or standard deviation?d) Is the choice of measure of spread
In the news. Find an article in a newspaper, a magazine, or the Internet that discusses an “average.”a) Does the article discuss the W’s for the data?b) What are the units of the variable?c) Is the average used the median or the mean? How can you tell?d) Is the choice of median or mean
Not a histogram. Find a graph other than a histogram that shows the distribution of a quantitative variable in a newspaper, a magazine, or the Internet.a) Does the article identify the W’s?b) Discuss whether the display is appropriate for the data.c) Discuss what the display reveals about the
Histogram. Find a histogram that shows the distribution of a variable in a newspaper, a magazine, or the Internet.a) Does the article identify the W’s?b) Discuss whether the display is appropriate.c) Discuss what the display reveals about the variable and its distribution.d) Does the article
Be a Simpson! Can you design a Simpson’s paradox? Two companies are vying for a city’s “Best Local Employer”award, to be given to the company most committed to hiring local residents. Although both employers hired 300 new people in the past year, Company Abrags that it deserves the award
Graduate admissions. A 1975 article in the magazine Science examined the graduate admissions process at Berkeley for evidence of sex discrimination. The table below shows the number of applicants accepted to each of four graduate programs:a) What percent of total applicants were admitted?b)
Delivery service. A company must decide which of two delivery services it will contract with. During a recent trial period, the company shipped numerous packages with each service and kept track of how often deliveries did not arrive on time. Here are the data:a) Compare the two services’ overall
Hospitals. Most patients who undergo surgery make routine recoveries and are discharged as planned. Others suffer excessive bleeding, infection, or other postsurgical complications and have their discharges from the hospital delayed. Suppose your city has a large hospital and a small hospital, each
Tattoos. A study by the University of Texas Southwestern Medical Center examined 626 people to see if an increased risk of contracting hepatitis C was associated with having a tattoo. If the subject had a tattoo, researchers asked whether it had been done in a commercial tattoo parlor or elsewhere.
Drivers’ licenses 2006. The following table shows the number of licensed U.S. drivers by age and by sex(www.dot.gov):a) What percent of total drivers are under 20?b) What percent of total drivers are male?c) Write a few sentences comparing the number of male and female licensed drivers in each
Graduate admissions. A 1975 article in the magazine Science examined the graduate admissions process at Berkeley for evidence of sex discrimination. The table below shows the number of applicants accepted to each of four graduate programs: Program Males accepted Females accepted (of applicants) 511
Delivery service. A company must decide which of two delivery services it will contract with. During a recent trial period, the company shipped numerous packages with each service and kept track of how often deliveries did not arrive on time. Here are the data:a) Compare the two services’ overall
Hospitals. Most patients who undergo surgery make routine recoveries and are discharged as planned. Others suffer excessive bleeding, infection, or other postsurgical complications and have their discharges from the hospital delayed. Suppose your city has a large hospital and a small hospital, each
Tattoos. A study by the University of Texas Southwestern Medical Center examined 626 people to see if an increased risk of contracting hepatitis C was associated with having a tattoo. If the subject had a tattoo, researchers asked whether it had been done in a commercial tattoo parlor or elsewhere.
Drivers’ licenses 2006. The following table shows the number of licensed U.S. drivers by age and by sex(www.dot.gov):a) What percent of total drivers are under 20?b) What percent of total drivers are male?c) Write a few sentences comparing the number of male and female licensed drivers in each
Antidepressants and bone fractures. For a period of five years, physicians at McGill University Health Center followed more than 5000 adults over the age of 50.The researchers were investigating whether people taking a certain class of antidepressants (SSRIs) might be at greater risk of bone
Anorexia. Hearing anecdotal reports that some patients undergoing treatment for the eating disorder anorexia seemed to be responding positively to the antidepressant Prozac, medical researchers conducted an experiment to investigate. They found 93 women being treated for anorexia who volunteered to
Obesity and exercise. The Centers for Disease Control and Prevention (CDC) has estimated that 19.8% of Americans over 15 years old are obese. The CDC conducts a survey on obesity and various behaviors. Here is a table on selfreported exercise classified by body mass index (BMI):a) Are these
Blood pressure. Acompany held a blood pressure screening clinic for its employees. The results are summarized in the table below by age group and blood pressure level:a) Find the marginal distribution of blood pressure level.b) Find the conditional distribution of blood pressure level within each
Twin births. In 2000, the Journal of the American Medical Association (JAMA) published a study that examined pregnancies that resulted in the birth of twins. Births were classified as preterm with intervention (induced labor or cesarean), preterm without procedures, or term/postterm.Researchers
Weather forecasts. Just how accurate are the weather forecasts we hear every day? The following table compares the daily forecast with a city’s actual weather for a year:a) On what percent of days did it actually rain?b) On what percent of days was rain predicted?c) What percent of the time was
Parking lots. A survey of autos parked in student and staff lots at a large university classified the brands by country of origin, as seen in the table.a) What percent of all the cars surveyed were foreign?b) What percent of the American cars were owned by students?c) What percent of the students
Back to school. Examine the table about ethnicity and acceptance for the Houston Independent School District’s magnet schools program, shown in Exercise 25.Does it appear that the admissions decisions are made independent of the applicant’s ethnicity? Explain.
More politics. Look once more at the table summarizing the political views of Intro Stats students in Exercise 22.a) Produce a graphical display comparing the conditional distributions of males and females among the three categories of politics.b) Comment briefly on what you see from the display in
Magnet schools revisited. The Chance magazine article described in Exercise 9 further examined the impact of an applicant’s ethnicity on the likelihood of admission to the Houston Independent School District’s magnet schools programs. Those data are summarized in the table below.a) What percent
Politics revisited. Look again at the table of political views for the Intro Stats students in Exercise 22.a) Find the conditional distributions (percentages) of political views for the females.b) Find the conditional distributions (percentages) of political views for the males.c) Make a graphical
More about seniors. Look again at the table of postgraduation plans for the senior class in Exercise 21.a) Find the conditional distributions (percentages) of plans for the white students.b) Find the conditional distributions (percentages) of plans for the minority students.c) Create a graph
Politics. Students in an Intro Stats course were asked to describe their politics as “Liberal,” “Moderate,” or“Conservative.” Here are the results:a) What percent of the class is male?b) What percent of the class considers themselves to be “Conservative”?c) What percent of the males
Seniors. Prior to graduation, a high school class was surveyed about its plans. The following table displays the results for white and minority students (the “Minority”group included African-American, Asian, Hispanic, and Native American students):a) What percent of the seniors are white?b)
The last picture show. Here’s another table showing information about 120 movies released in 2005. This table gives percentages of the table total:a) How can you tell that this table holds table percentages (rather than row or column percentages)?b) What was the most common genre/rating
Movies by genre and rating. Here’s a table that classifies movies released in 2005 by genre and MPAArating:a) The table gives column percents. How could you tell that from the table itself?b) What percentage of these movies were comedies?c) What percentage of the PG-rated movies were comedies?d)
Handguns. In an effort to reduce the number of gunrelated homicides, some cities have run buyback programs in which the police offer cash (often $50) to anyone who turns in an operating handgun. Chance magazine looked at results from a four-year period in Milwaukee.The table below shows what types
Teen smokers. The organization Monitoring the Future(www.monitoringthefuture.org) asked 2048 eighth graders who said they smoked cigarettes what brands they preferred. The table below shows brand preferences for two regions of the country. Write a few sentences describing the similarities and
Modalities. A survey of athletic trainers (Scott F. Nadler, Michael Prybicien, Gerard A. Malanga, and Dan Sicher,“Complications from Therapeutic Modalities: Results of a National Survey of Athletic Trainers.” Archives of Physical Medical Rehabilitation 84 [June 2003]) asked what modalities
Global warming. The Pew Research Center for the People and the Press (http://people-press.org) has asked a representative sample of U.S. adults about global warming, repeating the question over time. In January 2007, the responses reflected an increased belief that global warming is real and due to
Winter Olympics 2006. Twenty-six countries won medals in the 2006 Winter Olympics. The table lists them, along with the total number of medals each won:a) Try to make a display of these data. What problems do you encounter?b) Can you find a way to organize the data so that the graph is more
Oil spills 2008. Data from the International Tanker Owners Pollution Federation Limited (www.itopf.com) give the cause of spillage for 319 large oil tanker accidents from 1974–2008. Here are displays.a) Write a brief report interpreting what the displays show.b) Is a pie chart an appropriate
Plane crashes. An investigation compiled information about recent nonmilitary plane crashes (www.planecrashinfo.com). The causes, to the extent that they could be determined, are summarized in the table.a) Is it reasonable to conclude that the weather or mechanical failures caused only about 20% of
Causes of death 2006. The Centers for Disease Control and Prevention (www.cdc.gov) lists causes of death in the United States during 2006:a) Is it reasonable to conclude that heart or respiratory diseases were the cause of approximately 32% of U.S.deaths in 2006?b) What percent of deaths were from
Magnet schools again. The Chance article about the Houston magnet schools program described in Exercise 9 also indicated that 517 applicants were black or Hispanic, 292 Asian, and 946 white.Summarize the relative frequency distribution of ethnicity with a sentence or two (in the proper context, of
Magnet schools. An article in the Winter 2003 issue of Chance magazine reported on the Houston Independent School District’s magnet schools programs. Of the 1755 qualified applicants, 931 were accepted, 298 were wait-listed, and 526 were turned away for lack of space. Find the relative frequency
Ratings again. Here is a bar chart summarizing the 2005 movie ratings, as seen in the pie chart in Exercise 6.a) Which was the least common rating?b) An editorial claimed that there’s been a growth in PG-13 rated films that, according to the writer,“have too much sex and violence,” at the
Genres again. Here is a bar chart summarizing the 2005 movie genres, as seen in the pie chart in Exercise 5.a) Which genre was most common?b) Is it easier to see that in the pie chart or the bar chart?Explain. 30 40 30 20 20 10 A/A Comedy Drama Genre2 T/H
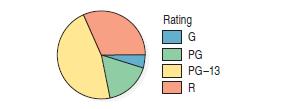
Movie ratings. The pie chart shows the ratings assigned to 120 first-run movies released in 2005.a) Is this an appropriate display for these data? Explain.b) Which was the most common rating? Rating G PG PG-13 R
Movie genres. The pie chart summarizes the genres of 120 first-run movies released in 2005.a) Is this an appropriate display for the genres?Why/why not?b) Which genre was least common? Genre2 Action/Adventure Comedy Drama Thriller/Horror
Tables in the news II. Find a contingency table of categorical data from a newspaper, a magazine, or the Internet.a) Is it clearly labeled?b) Does it display percentages or counts?c) Does the accompanying article tell the W’s of the variables?d) Do you think the article correctly interprets the
Tables in the news. Find a frequency table of categorical data from a newspaper, a magazine, or the Internet.a) Is it clearly labeled?b) Does it display percentages or counts?c) Does the accompanying article tell the W’s of the variable?d) Do you think the article correctly interprets the
Graphs in the news II. Find a pie chart of categorical data from a newspaper, a magazine, or the Internet.a) Is the graph clearly labeled?b) Does it violate the area principle?c) Does the accompanying article tell the W’s of the variable?d) Do you think the article correctly interprets the
Graphs in the news. Find a bar chart of categorical data from a newspaper, a magazine, or the Internet.a) Is the graph clearly labeled?b) Does it violate the area principle?c) Does the accompanying article tell the W’s of the variable?d) Do you think the article correctly interprets the
Indy 2009. The 2.5-mile Indianapolis Motor Speedway has been the home to a race on Memorial Day nearly every year since 1911. Even during the first race, there were controversies. Ralph Mulford was given the checkered flag first but took three extra laps just to make sure he’d completed 500
Horse race 2008. The Kentucky Derby is a horse race that has been run every year since 1875 at Churchill Downs, Louisville, Kentucky. The race started as a 1.5-mile race, but in 1896, it was shortened to 1.25 miles because experts felt that 3-year-old horses shouldn’t run such a long race that
Walking in circles. People who get lost in the desert, mountains, or woods often seem to wander in circles rather than walk in straight lines. To see whether people naturally walk in circles in the absence of visual clues, researcher Andrea Axtell tested 32 people on a football field. One at a
Refrigerators. In 2006, Consumer Reports published an article evaluating refrigerators. It listed 41 models, giving the brand, cost, size (cu ft), type (such as top freezer), estimated annual energy cost, an overall rating (good, excellent, etc.), and the repair history for that brand(percentage
Fuel economy. The Environmental Protection Agency(EPA) tracks fuel economy of automobiles based on information from the manufacturers (Ford, Toyota, etc.).Among the data the agency collects are the manufacturer, vehicle type (car, SUV, etc.), weight, horsepower, and gas mileage (mpg) for city and
Streams. In performing research for an ecology class, students at a college in upstate New York collect data on streams each year. They record a number of biological, chemical, and physical variables, including the stream name, the substrate of the stream (limestone, shale, or mixed), the acidity
Vineyards. Business analysts hoping to provide information helpful to American grape growers compiled these data about vineyards: size (acres), number of years in existence, state, varieties of grapes grown, average case price, gross sales, and percent profit.
Herbal medicine. Scientists at a major pharmaceutical firm conducted an experiment to study the effectiveness of an herbal compound to treat the common cold. They exposed each patient to a cold virus, then gave them either the herbal compound or a sugar solution known to have no effect on colds.
Flowers. In a study appearing in the journal Science, a research team reports that plants in southern England are flowering earlier in the spring. Records of the first flowering dates for 385 species over a period of 47 years show that flowering has advanced an average of 15 days per decade, an
Babies. Medical researchers at a large city hospital investigating the impact of prenatal care on newborn health collected data from 882 births during 1998–2000. They kept track of the mother’s age, the number of weeks the pregnancy lasted, the type of birth (cesarean, induced, natural), the
Age and party. The Gallup Poll conducted a representative telephone survey of 1180 American voters during the first quarter of 2007. Among the reported results were the voter’s region (Northeast, South, etc.), age, party affiliation, and whether or not the person had voted in the 2006 midterm
Arby’s menu. A listing posted by the Arby’s restaurant chain gives, for each of the sandwiches it sells, the type of meat in the sandwich, the number of calories, and the serving size in ounces. The data might be used to assess the nutritional value of the different sandwiches.
Schools. The State Education Department requires local school districts to keep these records on all students:age, race or ethnicity, days absent, current grade level, standardized test scores in reading and mathematics, and any disabilities or special educational needs.
Weighing bears. Because of the difficulty of weighing a bear in the woods, researchers caught and measured 54 bears, recording their weight, neck size, length, and sex.They hoped to find a way to estimate weight from the other, more easily determined quantities.
Molten iron. The Cleveland Casting Plant is a large, highly automated producer of gray and nodular iron automotive castings for Ford Motor Company. The company is interested in keeping the pouring temperature of the molten iron (in degrees Fahrenheit) close to the specified value of 2550 degrees.
Fitness. Are physically fit people less likely to die of cancer? An article in the May 2002 issue of Medicine and Science in Sports and Exercise reported results of a study that followed 25,892 men aged 30 to 87 for 10 years. The most physically fit men had a 55% lower risk of death from cancer
Movies. Some motion pictures are profitable and others are not. Understandably, the movie industry would like to know what makes a movie successful. Data from 120 first-run movies released in 2005 suggest that longer movies actually make less profit.
Honesty. Coffee stations in offices often just ask users to leave money in a tray to pay for their coffee, but many people cheat. Researchers at Newcastle University alternately taped two posters over the coffee station. During one week, it was a picture of flowers;during the other, it was a pair
Showing 5500 - 5600
of 5937
First
46
47
48
49
50
51
52
53
54
55
56
57
58
59
60
Step by Step Answers