New Semester
Started
Get
50% OFF
Study Help!
--h --m --s
Claim Now
Question Answers
Textbooks
Find textbooks, questions and answers
Oops, something went wrong!
Change your search query and then try again
S
Books
FREE
Study Help
Expert Questions
Accounting
General Management
Mathematics
Finance
Organizational Behaviour
Law
Physics
Operating System
Management Leadership
Sociology
Programming
Marketing
Database
Computer Network
Economics
Textbooks Solutions
Accounting
Managerial Accounting
Management Leadership
Cost Accounting
Statistics
Business Law
Corporate Finance
Finance
Economics
Auditing
Tutors
Online Tutors
Find a Tutor
Hire a Tutor
Become a Tutor
AI Tutor
AI Study Planner
NEW
Sell Books
Search
Search
Sign In
Register
study help
business
macroeconomics
Macroeconomics 7th Edition Olivier Jean Blanchard - Solutions
Suppose the government amends the constitution to prevent government officials from negotiating with terrorists.What are the advantages of such a policy? What are the disadvantages?
New Zealand rewrote the charter of its central bank in the early 1990s to make low inflation its only goal.Why would New Zealand want to do this?
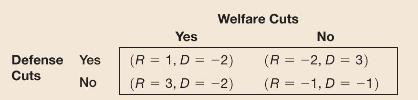
Deficit reduction as a prisoner's dilemma game Suppose there is a budget deficit. It can be reduced by cutting military spending, by cutting welfare programs, or by cutting both.The Democrats have to decide whether to support cuts in welfare programs. The Republicans have to decide whether to
Games, pre-commitment, and time inconsistency in the news Current events offer abundant examples of disputes in which the parties are involved in a game, try to commit themselves to lines of action in advance, and face issues of time inconsistency. Examples arise in the domestic political process,
The legislation governing the Federal Reserve Board The 1977 Federal Reserve Act, as amended in 1978, 1988, and 2000 governs the behavior of the Federal Reserve.a. In your opinion, does this excerpt from the Act make the policy goals of the Fed clear?
Using information in this chapter, label each of the following statements true, false, or uncertain. Explain briefly.a. The deficit is the difference between real government spending and taxes net of transfers.b. The primary deficit is the difference between real government spending and taxes net
Consider the following statement:A deficit during a war can be a good thing. First, the deficit is temporary, so after the war is over, the government can go right back to its old level of spending and taxes. Second, given that the evidence supports the Ricardian equivalence proposition, the
Consider an economy characterized by the following facts:i. The official budget deficit is \(4 \%\) of GDP.ii. The debt-to-GDP ratio is \(100 \%\).iii. The nominal interest rate is \(10 \%\).iv. The inflation rate is \(7 \%\).a. What is the primary deficit/surplus ratio to GDP?b. What is the
Assume that money demand takes the form\[\frac{M}{P}=Y\left[1-\left(r+\pi^{e}ight)ight]\]where \(Y=1,000\) and \(r=0.1\).a. Assume that, in the short run, \(\pi^{e}\) is constant and equal to \(25 \%\). Calculate the amount of seignorage for each annual rate of money growth, \(\Delta \mathrm{M} /
Consider the economy described in Problem 3 and assume that there is a fixed exchange rate, \(\bar{E}\). Suppose that financial investors worry that the level of debt is too high and that the government may devalue to stimulate output (and therefore tax revenues) to help pay down the debt.
Ricardian equivalence and fiscal policy First consider an economy in which Ricardian equivalence does not hold.a. Suppose the government starts with a balanced budget. Then, there is an increase in government spending, but there is no change in taxes. Show in an IS-LM diagram the effect of this
Consider an economy characterized by the following facts:i. The debt-to-GDP ratio is \(40 \%\).ii. The primary deficit is \(4 \%\) of GDP.iii. The normal growth rate is \(3 \%\).iv. The real interest rate is 3\%.a. Using your favorite spreadsheet software, compute the debtto-GDP ratio in 10 years,
The fiscal situation in the United States and in other countries From the FRED economic database at the Federal Reserve Bank of St. Louis, you can retrieve two series: General Government Gross Debt of the United States (GGGDTAUSA188N) and a measure of the primary deficit of all governments in the
Using the information in this chapter, label each of the following statements true, false, or uncertain. Explain briefly.a. The most important argument in favor of a positive rate of inflation in OECD countries is seignorage.b. Fighting inflation should be the Fed's only purpose.c. Inflation and
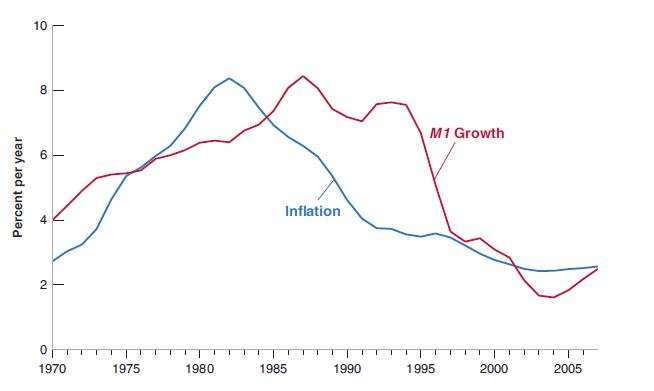
Breaking the link between money growth and inflation in the medium run The money demand relationship in Chapter 4 is used implicitly in Figure 23-1. That relation is\[\frac{M}{P}=Y L(i)\]The central bank in conjunction with the political authorities chooses an inflation target \(\pi^{*}\).a. Derive
Inflation targets Consider a central bank that has an inflation target, \(\pi^{*}\). We studied two versions of the Phillips curve in Chapter 9. The general Phillips curve is:\[\pi_{t}-\pi_{t}^{e}=-\alpha\left(u_{t}-u_{n}ight)\]The first version of the Phillips curve in Chapter 9
Indexed bonds and inflation uncertainty In Chapter 14, in a Focus Box titled "The Vocabulary of Bond Markets," the concept of an inflation-indexed bond was introduced. Although such bonds are typically long in maturity, the example that follows compares a standard one-year Treasury bill with an
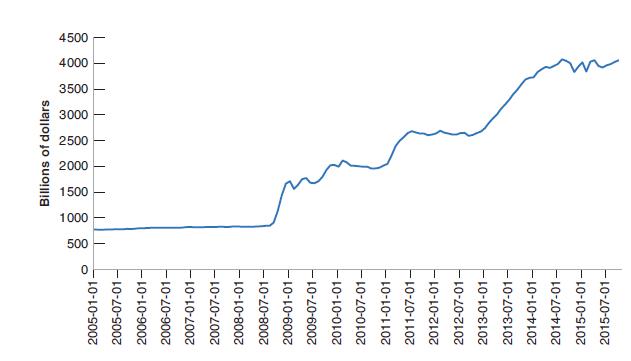
Unwinding unconventional monetary policy It was noted in the text that the Federal Reserve purchased, in addition to Treasury bills, large amounts of mortgage-backed securities and long-term government bonds as part of quantitative easing. Figure 23-2 shows that as of the end of 2015, there were
The maximum loan-to-value ratio Most home-buyers purchase their home with a combination of a cash down payment and a mortgage. The loan-to-value ratio is a rule that establishes the maximum mortgage loan allowed on a home purchase.a. If a home costs \(\$ 300,000\) and the maximum loan-to-value
Taxes, inflation, and home ownership In this chapter, we discussed the effect of inflation on the effective capital-gains tax rate on the sale of a home. In this question, we explore the effect of inflation on another feature of the tax code- the deductibility of mortgage interest.Suppose you have
Suppose you have been elected to Congress. One day, one of your colleagues makes the following statement:The Fed chair is the most powerful economic policy maker in the United States. We should not turn over the keys to the economy to someone who was not elected and therefore has no accountability.
The frequency of the zero lower bound around the world Use the FRED database at the Federal Reserve Bank of St Louis to find the monthly average nominal policy interest rates for four major players. The series for these rates are: United States, federal funds (FEDFUNDS); United Kingdom,
Chinese economic growth is the outstanding feature of the world economic scene over the past two decades.a. In 2014, U.S. output was $17.4 trillion, and Chinese output was $10.4 trillion. Suppose that from now on, the output of China grows at an annual rate of 6. 5% per year, whereas the output of
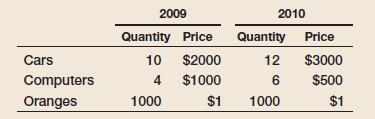
An economy produces three goods: cars, computers, and oranges. Quantities and prices per unit for years 2009 and 2010 are as follows:a. What is nominal GDP in 2009 and in 2010? By what percentage does nominal GDP change from 2009 to 2010?b. Using the prices for 2009 as the set of common prices,
Consider the economy described in Problem 4.a. Use the prices for 2009 as the set of common prices to compute real GDP in 2009 and in 2010. Compute the GDP deflator for 2009 and for 2010, and compute the rate of inflation from 2009 to 2010.b. Use the prices for 2010 as the set of common prices to
Consider the economy described in Problem 4.a. Construct real GDP for years 2009 and 2010 by using the average price of each good over the two years.b. By what percentage does real GDP change from 2009 to 2010?c. What is the GDP deflator in 2009 and 2010? Using the GDP deflator, what is the rate of
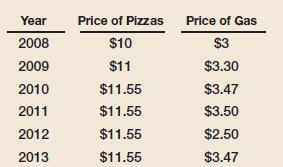
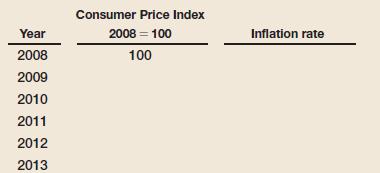
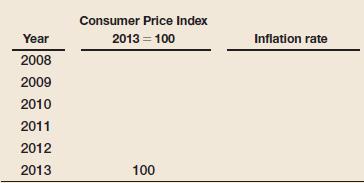
The Consumer Price Index represents the average price of goods that households consume. Many thousands of goods are included in such an index. Here consumers are represented as buying only food (pizza) and gas as their basket of goods. Here is a representation of the kind of data the Bureau of
Using macroeconomic relations:a. Okun’s law stated that when output growth is higher than usual, the unemployment rate tends to fall. Explain why usual output growth is positive.b. In which year, a year where output growth is 2% or a year where output growth is –2%, will the unemployment rate
Comparing the recessions of 2001 and 2009. One very easy source for data is the Federal Reserve Bank of St. Louis FRED database. The series that measures real GDP is GDPC1, real GDP in each quarter of the year expressed at a seasonally adjusted annual rate (denoted SAAR). The monthly series for the
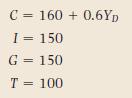
Use the economy described in Problem 2.a. Solve for equilibrium output. Compute total demand. Is it equal to production? Explain.b. Assume that G is now equal to 110. Solve for equilibrium output. Compute total demand. Is it equal to production?Explain.c. Assume that G is equal to 110, so output is
Using fiscal policy in this first (and simplest model) to avoid the recession of 2009: GDP in 2009 was roughly $15,000 billion. You learned in Chapter 1 that GDP fell by approximately 3 percentage points in 2009.a. How many billion dollars is 3 percentage points of$15,000 billion?b. If the
Suppose that a person’s yearly income is $60,000. Also suppose that this person’s money demand function is given by:a. What is this person’s demand for money when the interest rate is 5%? 10%?b. Explain how the interest rate affects money demand.c. Suppose that the interest rate is 10%. In
Consider a bond that promises to pay $100 in one year.a. What is the interest rate on the bond if its price today is$75? $85? $95?b. What is the relation between the price of the bond and the interest rate?c. If the interest rate is 8%, what is the price of the bond today?
In this chapter, you learned that an increase in the interest rate makes bonds more attractive, so it leads people to hold more of their wealth in bonds as opposed to money. However, you also learned that an increase in the interest rate reduces the price of bonds. How can an increase in the
Choosing the quantity of money or the interest rate Suppose that money demand is given by:where $Y is $100.a. If the Federal Reserve Bank sets an interest rate target of 5%, what is the money supply the Federal Reserve must create?b. If the Federal Reserve Bank wants to increase i from 5 to 10%,
Monetary policy in a liquidity trap Suppose that money demand is given by:as long as interest rates are positive. The questions below then refer to situations where the interest rate is zero.a. What is the demand for money when interest rates are zero and $Y = 80?b. If $Y = 80, what is the smallest
Go to the Web site for the Federal Reserve Board of Governors (www.federalreserve.gov) and download the most recent monetary policy press release of the Federal Open Market Committee (FOMC). Make sure you get the most recent FOMC press release and not simply the most recent Fed press release.a.
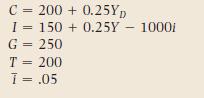
Consider the following numerical example of the IS-LM model:a. Derive the IS relation. (Hint: You want an equation with Y on the left side and everything else on the right.)b. The central bank sets an interest rate of 5%. How is that decision represented in the equations?c. What is the level of
In 2001, the Fed pursued an expansionary monetary policy and reduced interest rates. At the same time, President George W. Bush pushed through legislation that lowered income taxes.a. Illustrate the effect of such a policy mix on output.b. How does this policy mix differ from the Clinton-Greenspan
The (less paradoxical) paradox of saving A chapter problem at the end of Chapter 3 considered the effect of a drop in consumer confidence on private saving and investment, when investment depended on output but not on the interest rate.Here, we consider the same experiment in the context of the
Compute the real interest rate using the exact formula and the approximation formula for each set of assumptions listed in (a) through (c).a. \(i=4 \% ; \quad \pi^{e}=2 \%\)b. \(i=15 \% ; \quad \pi^{e}=11 \%\)c. \(i=54 \% ; \quad \pi^{e}=46 \%\)
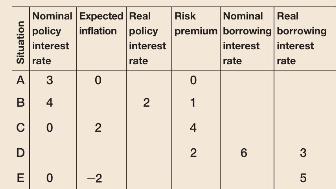
Fill in the table below and answer the questions that relate to the data in the tablea. Which situations correspond to a liquidity trap as defined in Chapter 4?b. Which situations correspond to the case where the nominal policy interest rate is at the Zero Lower Bound?c. Which situation has the
Consider a simple bank that has assets of 100, capital of 20 , and checking deposits of 80. Recall from Chapter 4 that checking deposits are liabilities of a bank.a. Set up the bank's balance sheet.b. Now suppose that the perceived value of the bank's assets falls by 10. What is the new value of
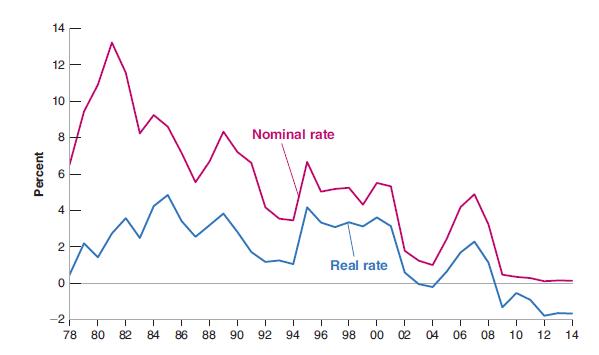
Nominal and real interest rates around the worlda. There are a few episodes of negative nominal interest rates around the world. Some may or may not be in play as you read this book. The Swiss nominal policy rate, the Swiss equivalent of the federal funds rate is series IRSTCI01CHM156N from the
Calculating the risk premium on bonds The text presents a formula where \[ (1+i)=(1-p)(1+i+x)+p(0) \]\(p\) is the probability the bond does not pay at all (the bond issuer is bankrupt) and has a zero return.\(i\) is the nominal policy interest rate.\(x\) is the risk premium.a. If the probability
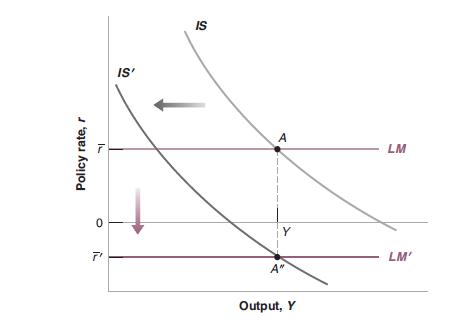
Un conventional monetary policy: financial policy and quantitative easing We have written the IS-LM model in terms:\[\begin{align*}\text { IS relation: } & Y=C(Y-T)+I(Y, r+x)+G \tag{6.5}\\L M \text { relation: } & r=\bar{r} \tag{6.6}\end{align*}\]Interpret the interest rate as the federal
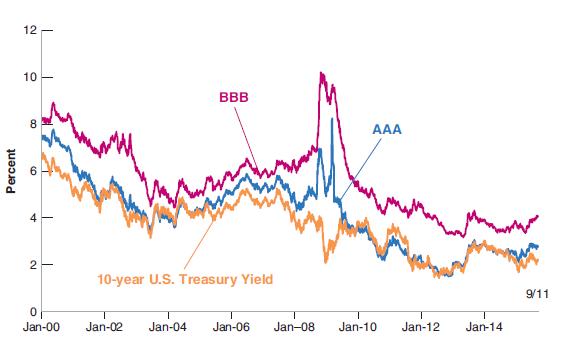
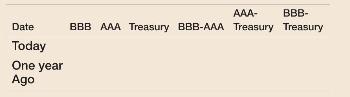
The spread between riskless and risky bonds The text used Figure 6-3 to describe fluctuations in the spreads between riskless rate on 10-year U.S. Treasury bonds and 10-year \(A A A\) and BBB corporate bonds. This figure can be updated by going to the Federal Reserve Bank of St. Louis FRED data
Answer the following questions using the information provided in this chapter.a. As a percentage of employed workers, what is the size of the flows into and out of employment (i.e., hires and separations) each month?b. As a percentage of unemployed workers, what is the size of the flows from
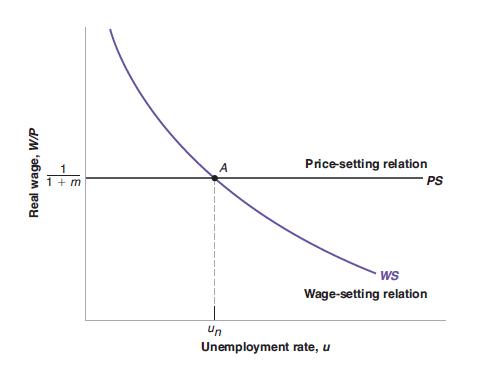
The Existence of unemploymenta. Consider Figure 7-6. Suppose the unemployment rate is very low. How does the low unemployment rate change the relative bargaining power of workers and firms? What do your answers imply about what happens to the wage as the unemployment rate gets very low?Figure 7-6b.
You learned in Chapter 2 that informal work at home (e.g., preparing meals, taking care of children) is not counted as part of GDP. Such work also does not constitute employment in labor-market statistics. With these observations in mind, consider two economies, each with 100 people, divided into
Go to the Web site maintained by the U.S. Bureau of Labor Statistics (www.bls.gov). Find the latest Employment Situation Summary. Look under the link "National Employment."a. What are the latest monthly data on the size of the U.S. civilian labor force, on the number of unemployed, and on the
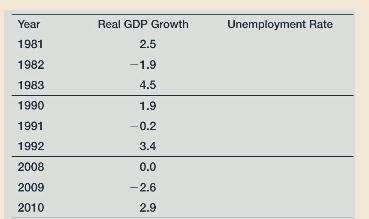
The typical dynamics of unemployment over a recession The table below shows the behavior of annual real GDP growth during three recessions. These data are from Table B-4 of the Economic Report of the President.Use Table B-35 from the Economic Report of the President to fill in the annual values of
Discuss the following statements.a. The Phillips curve implies that when unemployment is high, inflation is low, and vice versa. Therefore, we may experience either high inflation or high unemployment, but we will never experience both together.b. As long as we do not mind having high inflation, we
Changes in the natural rate of unemploymenta. Repeat Problem 6 but now draw separate graphs for the period 1970 to 1990 and the period since 1990.b. Do you find that the relation between inflation and unemployment is different in the two periods? If so, how has the natural rate of unemployment
Changes in the natural rate of unemploymenta. Repeat Problem 6 but now draw separate graphs for the period 1970 to 1990 and the period since 1990.b. Do you find that the relation between inflation and unemployment is different in the two periods? If so, how has the natural rate of unemployment
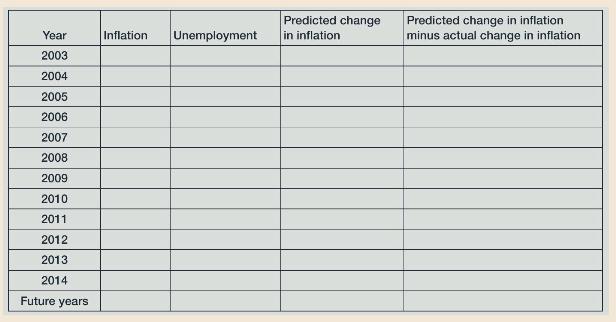
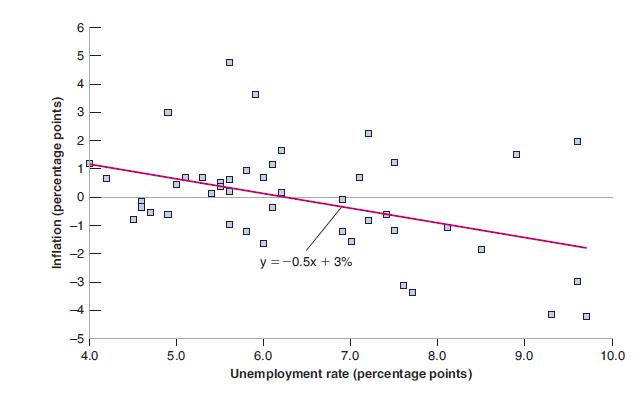
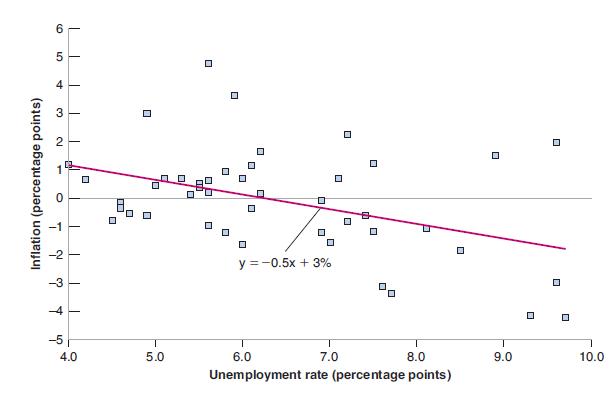
Using the natural rate of unemployment to predict changes in inflation The estimated Phillips curve from Figure 8.4 is\[\pi_{t}-\pi_{t-1}=3.0-0.5 u_{t}\]Fill in the table below using the data collected in Question 6. You will want to use a spreadsheeta. Assess the ability of the Phillips curve to
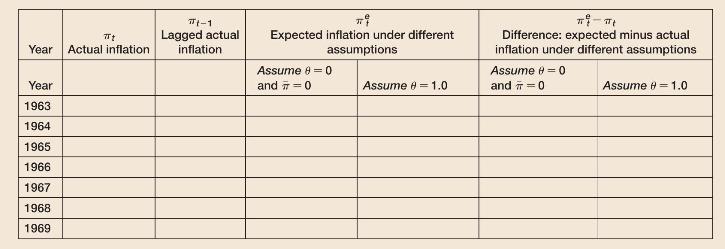
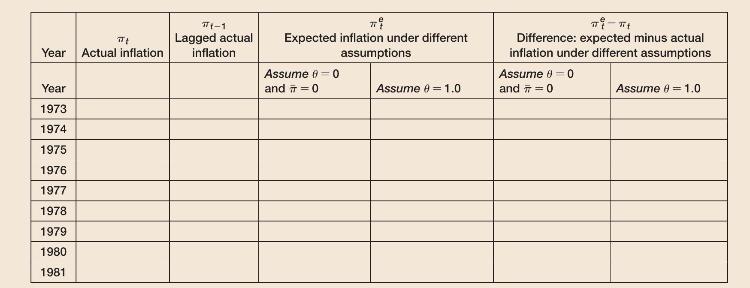
The rate of inflation and expected inflation in different decades Fill in the values in table below for inflation and expected inflation using the 1960s. Here you will have to find the data using the FRED data base operated by the Federal Reserve Bank of St. Louis. The series are found in
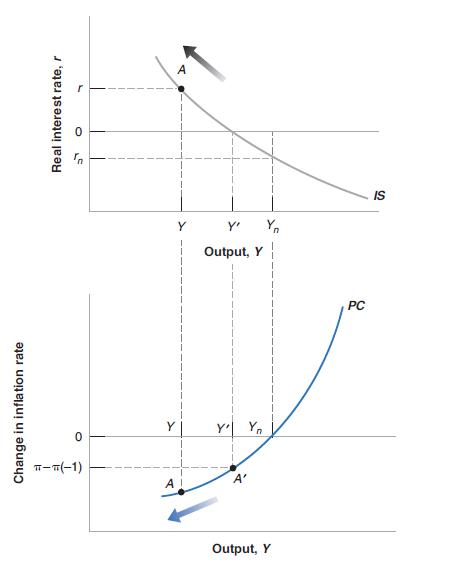
The two paths to the medium-run equilibrium explored in this chapter make two different assumptions about the formation of the level of expected inflation. One path assumes the level of expected inflation equals lagged inflation. The level of expected inflation changes over time. The other path
A shock to aggregate supply will also have different outcomes when there are different assumptions about the formation of the level of expected inflation. As in Question 3, one path assumes that the level of expected inflation equals lagged inflation. The level of expected inflation changes over
Okun's Law is written as \(u-u(-1)=-0.4\left(g_{Y}-3 \%ight)\)a. What is the sign of \(u-u(-1)\) in a recession? What is the sign of \(u-u(-1)\) in a recovery?b. Explain where the \(3 \%\) number comes from?c. Explain why the coefficient on the term \(\left(g_{Y}-3 \%ight)\) is -0.4 and not -1 .d.
Consider the data in the Focus Box, "Deflation in the Great Depression."a. Do you believe that output had returned to its potential level in 1933?b. Which years suggest a deflation spiral as described in Figure 9-3?Figure 9-3c. Make the argument that if the expected level of inflation had remained
Consider the data in the Focus Box, "Deflation in the Great Depression."a. Calculate real interest rates in each year making the assumption that the expected level of inflation is last year's rate of inflation. The rate of inflation in 1928 was \(-1.7 \%\). Do the changes in real interest rates
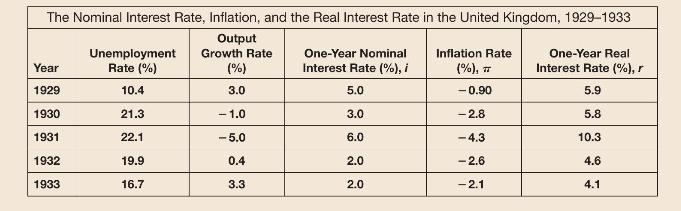
The Great Depression in the United Kingdom Answer the following questions based on information found in the table belowa. Is there evidence of the deflation spiral from 1929 to 1933 in the United Kingdom?b. Is there evidence of the effect of high real interest rates on output?c. Is there evidence
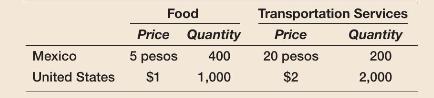
Assume that the average consumer in Mexico and the average consumer in the United States buy the quantities and pay the prices indicated in the following table:a. Compute U.S. consumption per capita in dollars.b. Compute Mexican consumption per capita in pesos.c. Suppose that 1 dollar is worth 10
Consider the production function:a. Compute output when \(K=49\) and \(N=81\).b. If both capital and labor double, what happens to output?c. Is this production function characterized by constant returns to scale? Explain.d. Write this production function as a relation between output per worker and
Between 1950 and 1973, France, Germany, and Japan all experienced growth rates that were at least two percentage points higher than those in the United States. Yet the most important technological advances of that period were made in the United States. How can this be?
Convergence between Japan and the United States since 1960 The Bureau of Labor Statistics has a user-friendly Web site of GDP per capita at http://www.bls.gov/ilc/intl_gdp_capita_gdp_hour.htm\#tableO. Find GDP per capita in Japan and in the United States in 1960, 1990, and the most recent year.a.
Growth successes and failures Go to the Web site containing the Penn World Table and collect data on real GDP per capita (chained series) for 1970 for all available countries. Do the same for a recent year of data, say one year before the most recent year available in the Penn World Table. (If you
Using the information in this chapter, label each of the following statements true, false, or uncertain. Explain briefly.a. The saving rate is always equal to the investment rate.b. A higher investment rate can sustain higher growth of output forever.c. If capital never depreciated, growth could go
Consider the following statement: "The Solow model shows that the saving rate does not affect the growth rate in the long run, so we should stop worrying about the low U.S. saving rate. Increasing the saving rate wouldn't have any important effects on the economy." Explain why you agree or disagree
In Chapter 3 we saw that an increase in the saving rate can lead to a recession in the short run (i.e., the paradox of saving). We examined the issue in the medium run in Problem 5 at at the end of Chapter 7. We can now examine the long-run effects of an increase in saving.Using the model presented
Discuss how the level of output per person in the long run would likely be affected by each of the following changes:a. The right to exclude saving from income when paying income taxes.b. A higher rate of female participation in the labor market (but constant population).
Suppose the United States moved from the current pay-asyou-go Social Security system to a fully funded one and financed the transition without additional government borrowing. How would the shift to a fully funded system affect the level and the rate of growth of output per worker in the long run?
Suppose that the production function is given by:\[Y=0.5 \sqrt{K} \sqrt{N}\]a. Derive the steady-state levels of output per worker and capital per worker in terms of the saving rate, \(s\), and the depreciation rate, \(\delta\).b. Derive the equation for steady-state output per worker and
The Cobb-Douglas production function and the steady state This problem is based on the material in the chapter appendix. Suppose that the economy's production function is given by:\[Y=K^{\alpha} N^{1-\alpha}\]and assume that \(\alpha=1 / 3\).a. Is this production function characterized by constant
Continuing with the logic from Problem 7, suppose that the economy's production function is given by \(Y=K^{1 / 3} N^{2 / 3}\) and that both the saving rate, \(s\), and the depreciation rate, \(\delta\) are equal to 0. 10 .a. What is the steady-state level of capital per worker?b. What is the
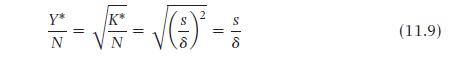
Deficits and the capital stock For the production function, \(Y=\sqrt{K} \sqrt{N}\) equation (11.9)gives the solution for the steady-state capital stock per worker.a. Retrace the steps in the text that derive equation (11.9).Equation 11.9b. Suppose that the saving rate, \(s\), is initially \(15
RED and growtha. Why is the amount of R\&D spending important for growth? How do the appropriability and fertility of research affect the amount of R\&D spending?How do each of the policy proposals listed in (b) through (e) affect the appropriability and fertility of research, RED spending in the
Sources of technological progress: Leaders versus followersa. Where does technological progress come from for the economic leaders of the world?b. Do developing countries have other alternatives to the sources of technological progress you mentioned in part (a)?c. Do you see any reasons developing
For each of the economic changes listed in (a) and (b), assess the likely impact on the growth rate and the level of output over the next five years and over the next five decades.a. A permanent reduction in the rate of technological progress.b. A permanent reduction in the saving rate.
Suppose that the economy's production function is\[Y=\sqrt{K} \sqrt{A N}\]that the saving rate, s, is equal to \(16 \%\), and that the rate of depreciation, \(\delta\), is equal to \(10 \%\). Suppose further that the number of workers grows at \(2 \%\) per year and that the rate of technological
Suppose an economy is characterized by the following equations:\[\begin{gathered}\text { Price setting: } P=(1+m)(W / A) \\\text { Wage setting: } W=A^{e} P^{e}(1-u)\end{gathered}\]a. Solve for the unemployment rate if \(P^{e}=P\) but \(A^{e}\) does not necessarily equal \(A\). Explain the effects
Discuss the following statement: "Higher labor productivity allows firms to produce more goods with the same number of workers and thus to sell the goods at the same or even lower prices. That's why increases in labor productivity can permanently reduce the rate of unemployment without causing
How might the policy changes in (a) through (d) the wage gap between low-skill and high-skill workers in the United States?a. Increased spending on computers in public schools.b. Restrictions on the number of foreign temporary agricultural workers allowed to enter the United States.c. An increase
Technological progress, agriculture, and employment Discuss the following statement: "Those who argue that technological progress does not reduce employment should look at agriculture. At the start of the last century, there were more than 11 million farm workers. Today, there are fewer than 1
Productivity and the aggregate supply curve Consider an economy in which production is given by:\[Y=A N\]Assume that price setting and wage setting are described in the following equations:\[\begin{aligned}& \text { Price setting: } P=(1+m)(W / A) \\& \text { Wage setting: } W=A^{e}
The churn The Bureau of Labor Statistics presents a forecast of occupations with the largest job decline and the largest job growth. Examine the tables at www.bls.gov/emp/emptab4.htm (for the largest job decline) and www.bls.gov/emp/emptab3.htm (for the largest job growth).a. Which occupations in
Income Inequalitya. What evidence is presented in the text that income inequality has increased over time in the United States?b. Use supply and demand of educated workers to explain the increase in income inequality.c. Use supply and demand of less-educated workers to explain the increase in
Using the information in this chapter, label each of the following statements true, false, or uncertain. Explain briefly.a. The present discounted value of a stream of returns can be calculated in real or nominal terms.b. The higher the one-year interest rate, the lower the present discounted value
For which of the problems listed in (a) through (c) would you want to use real payments and real interest rates, and for which would you want to use nominal payments and nominal interest rates to compute the expected present discounted value? In each case, explain why.a. Estimating the present
Compute the two-year nominal interest rate using the exact formula and the approximation formula for each set of assumptions listed in (a) through (c).a. \(i_{t}=2 \% ; i_{t+1}^{e}=3 \%\)b. \(i_{t}=2 \% ; i_{t+1}^{e}=10 \%\)c. \(i_{t}=2 \% ; i_{t+1}^{e}=3 \%\). The term premium on a two-year bond
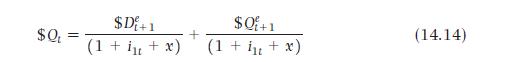
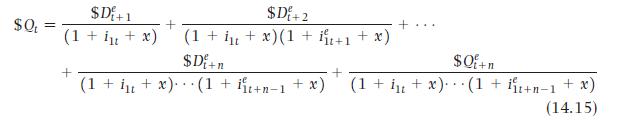
The equity premium and the value of stocksa. Explain why, in equation (14.14), it is important that the stock is ex-dividend, that is, it has just paid its dividend and expects to pay its next dividend in one year.b. Using equation (14.14), explain the contribution of each component to today's
Approximating the price of long-term bonds The present value of an infinite stream of dollar payments of\(\$ z\) (that starts next year) is \(\$ \mathrm{z} / \mathrm{i}\) when the nominal interest rate, \(\mathrm{i}\), is constant. This formula gives the price of a consol - a bond paying a fixed
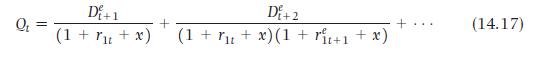
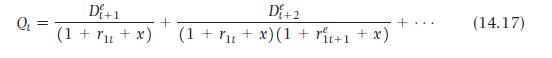
Monetary policy and the stock market Assume all policy rates, current and expected into the future had been \(2 \%\). Suppose the Fed decides to tighten monetary policy and increase the short-term policy rate \(\left(r_{1 t}ight)\) from \(2 \%\) to \(3 \%\).a. What happens to stock prices if the
Regular IRAs versus Roth IRAs You want to save \(\$ 2,000\) today for retirement in 40 years. You have to choose between the two plans listed in (i) and (ii).i. Pay no taxes today, put the money in an interest-yielding account, and pay taxes equal to \(25 \%\) of the total amount withdrawn at
House prices and bubbles Houses can be thought of as assets with a fundamental value equal to the expected present discounted value of their future real rents.a. Would you prefer to use real payments and real interest rates to value a house or nominal payments and nominal interest rates?b. The rent
The Economist annually publishes The Economist House Price Index. It attempts to assess which housing markets, by country, are the most overvalued or undervalued relative to fundamentals. Find the most recent version of this data on the Web.a. One index of overvaluation is the ratio of house prices
Using the information in this chapter, label each of the following statements true, false, or uncertain. Explain briefly.a. For a typical college student, human wealth and nonhuman wealth are approximately equal.b. Natural experiments, such as retirement, do not suggest that expectations of future
A consumer has nonhuman wealth equal to \(\$ 100,000\). She earns \(\$ 40,000\) this year and expects her salary to increase by \(5 \%\) in real terms each year for the following two years. She will then retire. The real interest rate is equal to \(0 \%\) and is expected to remain at \(0 \%\) in
A pretzel manufacturer is considering buying another pretzel-making machine that costs \(\$ 100,000\). The machine will depreciate by \(8 \%\) per year. It will generate real profits equal to \(\$ 18,000\) next year, \(\$ 18,000(1-8 \%)\) two years from now (that is, the same real profits but
Showing 5200 - 5300
of 7318
First
46
47
48
49
50
51
52
53
54
55
56
57
58
59
60
Last
Step by Step Answers